- Aave became the first DeFi protocol to cross $60 billion in net deposits, signaling strong capital confidence.
- Despite healthy fundamentals, spot and derivatives trading volume have declined, while open interest quietly climbs.
- Aave hovers at key support levels; a break above $280 could spark a bullish continuation, while failure below $250 may lead to further downside.
Aave is currently stabilizing around the $265 level following a sharp pullback, while marking a major on-chain achievement: becoming the first DeFi protocol to surpass $60 billion in net deposits.This figure, which represents the difference between total assets supplied and assets borrowed, signals strong capital inflows and growing confidence in Aave’s lending ecosystem. Founder Stani Kulechov highlighted this as a pivotal moment for decentralized finance.
DeFiLlama data backs this momentum. Aave’s total value locked surged by over 45%, rising from $24 billion in early July to nearly $35 billion. Meanwhile, network fee revenues jumped from $48 million in June to $65 million in July, reflecting increased borrower engagement and broader usage. On August 6, Aave further enhanced its developer ecosystem with the launch of its V3 toolkit, which includes SDKs, APIs, and React hooks. These tools allow protocols to deploy customizable lending vaults with modular risk strategies, enhancing Aave’s integration across DeFi applications.
Newsletter
Get weekly updates on the newest crypto stories, case studies and tips right in your mailbox.
Trading activity slows despite bullish fundamentals
Despite strong protocol fundamentals, trading activity has cooled. According to Coinglass, Aave’s 24-hour spot trading volume dropped 13% to $297 million, while derivatives volume declined by 19.3% to $503.6 million. However, open interest climbed 4.1% to $561.9 million, signaling that leverage is slowly building. This type of positioning is often seen as a precursor to a directional move in price action.
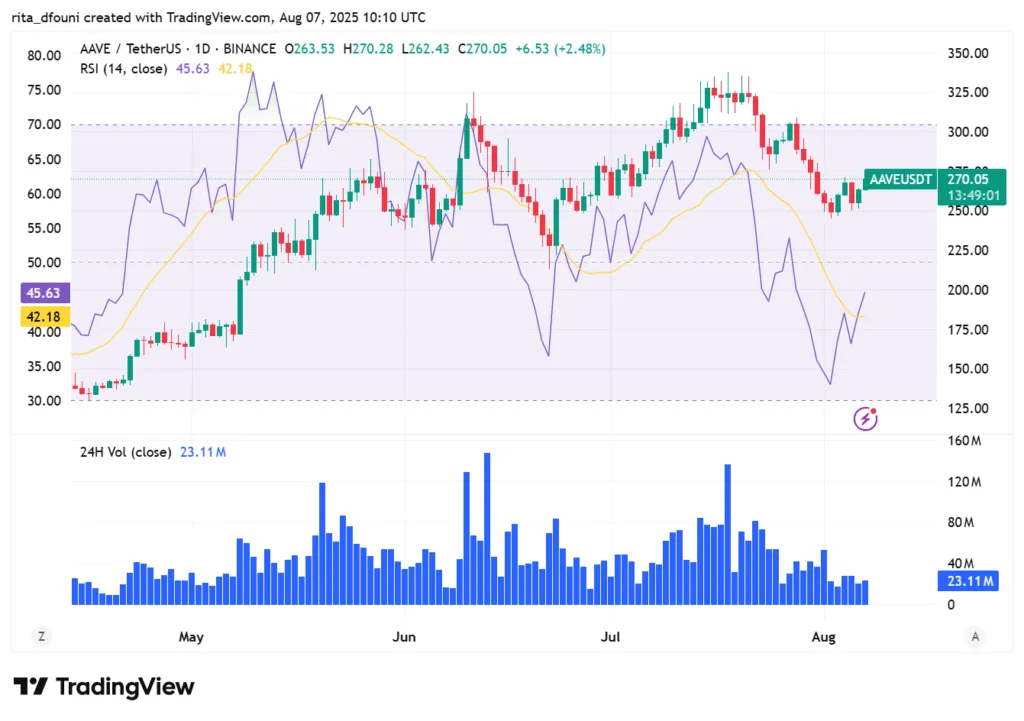
From a technical lens, Aave is hovering around key support levels. The MACD remains in negative territory at -9.31, while the RSI sits neutrally at 43.3. Long-term moving averages like the 100-day and 200-day SMAs are holding bullish ground, but short- to mid-term EMAs (20, 30, and 50-day) suggest a bearish tilt. The price is hovering just above the lower Bollinger Band, a zone that has historically provided support during consolidations. Momentum indicators such as the Stochastic RSI and Awesome Oscillator remain neutral, though early signs of a bullish reversal are starting to surface.

Aave is recovering from recent lows as the RSI shows signs of upward momentum, indicating a potential bullish reversal as price action nears resistance at the 20-day EMA, while volume remains moderate.
A decisive move above the 20-day EMA and a firm close beyond $280 would likely confirm a bullish continuation toward the $310–$315 resistance area. On the downside, failure to hold the $250–$255 support range could pave the way for a drop back toward the June low near $230. Any increase in sell-side volume beneath the Bollinger Band could intensify this downside move.


