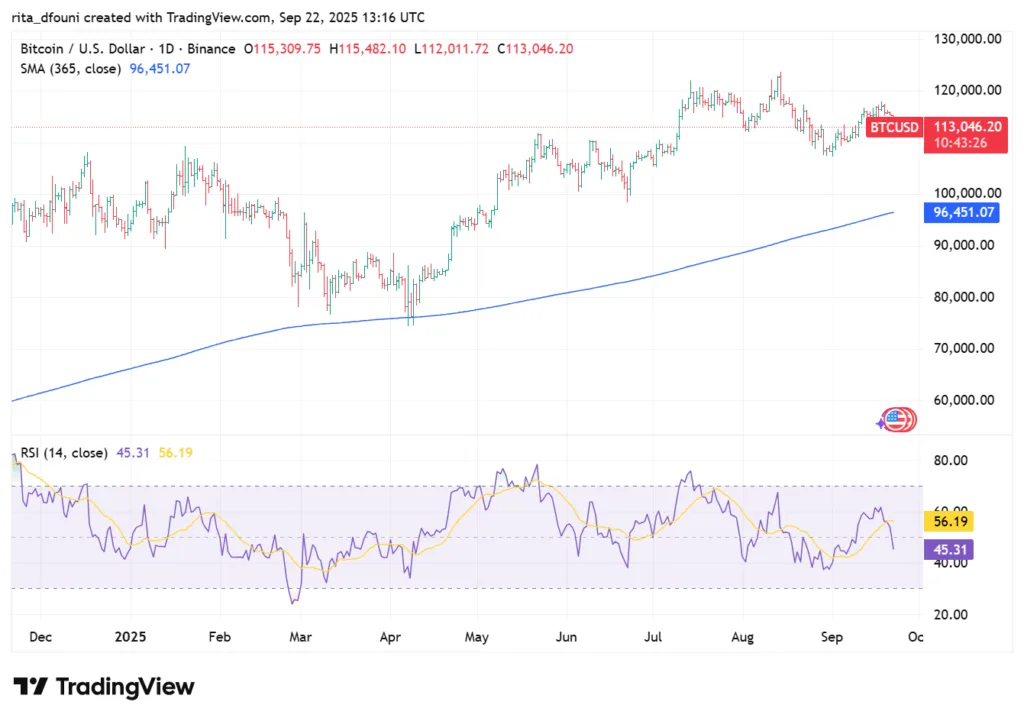
- Bitcoin (BTC) held the USD 112,000–113,000 support range, but a daily close exceeding USD 115,000 is necessary to trigger upward momentum toward USD 117,500–120,000.
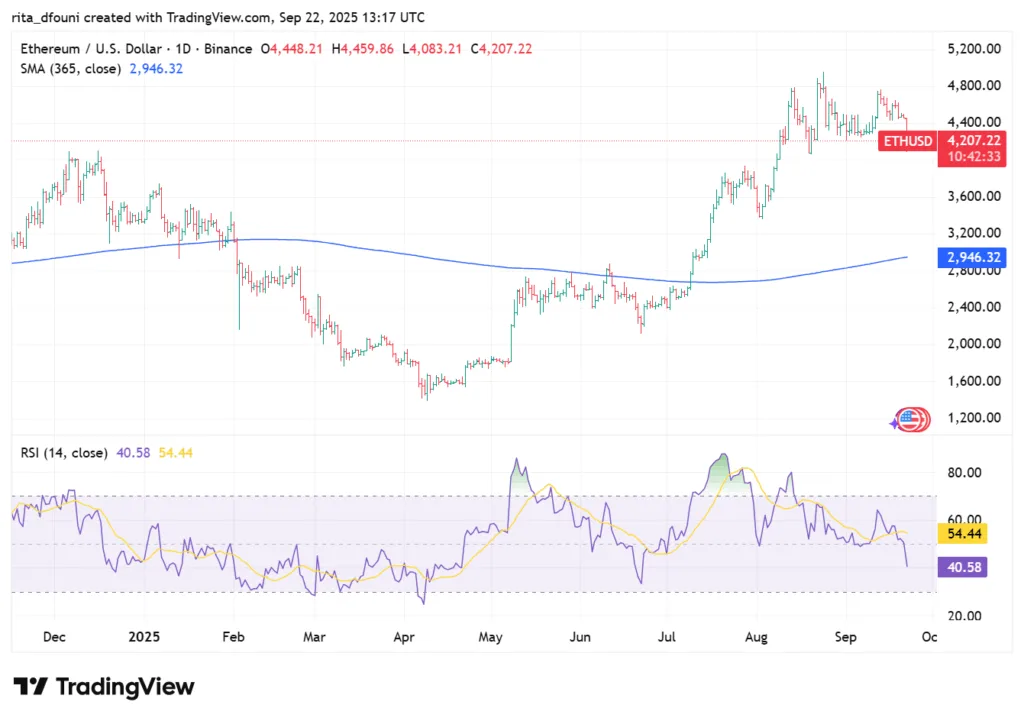
- Ethereum (ETH) continues to be stuck beneath the USD 4,380 resistance; regaining it sets sights on USD 4,500–4,650, whereas a failure poses the risk of a decline to USD 4,100.
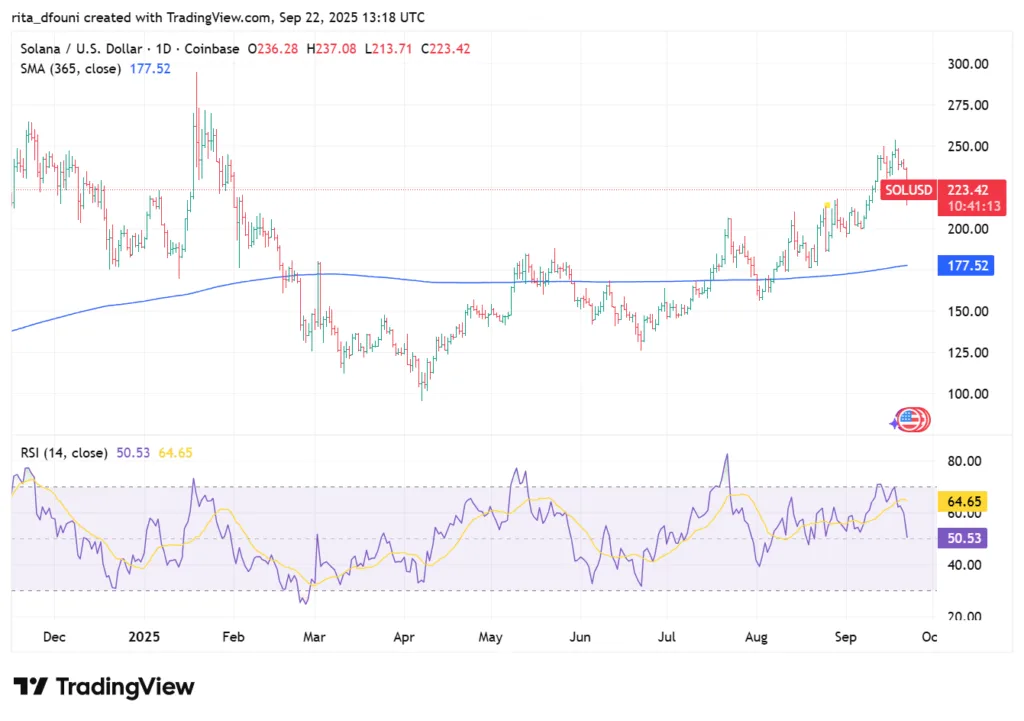
- Solana (SOL) is stabilizing between USD 221–223 support and USD 235–236 resistance, with a move above the latter aiming for USD 245–250.
- Cardano (ADA) is confined between the support levels of USD 0.82–0.84 and the resistance levels of USD 0.90–0.905; the outcome will determine if ADA rises to USD 0.96–1.02 or declines toward USD 0.78–0.80.
- XRP is facing resistance at the USD 3.00–3.03 range; a breakout could lead to USD 3.20–3.30, whereas a drop below USD 2.91–2.95 threatens to push it down to USD 2.85–2.88.
- In all fields, the Fed’s 50 bp rate reduction enhances macro liquidity for risk assets; however, uncertainty in equities and careful positioning in derivatives maintain a tight market, anticipating clear catalysts
Bitcoin (BTC) deep dive

Technical structure
On September 22, 2025, Bitcoin remained in the range of USD 113,000–114,000, stabilizing following the previous week’s fluctuations linked to the Fed’s 50 bp rate reduction. Intraday movements noted a peak close to USD 114,500 and a bottom at USD 112,600, restricting BTC below the vital USD 115,000 breakout threshold. Support stands at USD 111,800–112,000, and a break below this level may lead to a decline toward USD 110,000–109,500. A daily close above USD 115,000–115,250 would, nonetheless, change sentiment to bullish and pave the way for USD 117,500 and possibly USD 120,000.
Derivatives & positioning
Funding rates decreased from previous peaks, indicating a reduction of excessive leverage. Open interest stays stable at high levels, allowing for growth without the risk of immediate liquidation. Options data indicates strong call interest at USD 115,000 and USD 120,000 strikes, with dealers hedging higher a configuration that might drive momentum once the spot surpasses resistance.
On-chain & ecosystem
On-chain indicators continue to be positive. Nearly 1 million daily active addresses exist, and fees have stabilized after the meme-driven surges in August. Miner reserves have risen slightly, showing moderation from supply-side influences. Long-term holders remain prevalent, with over 68% of supply unchanged for more than a year, emphasizing that current activity is primarily influenced by short-term traders instead of structural selling.
Newsletter
Get weekly updates on the newest crypto stories, case studies and tips right in your mailbox.
Macro alignment
BTC is strongly connected to equity flows in the U.S. The Fed’s accommodative rate cut enhanced liquidity, but weak indicators from China and Europe dampened global sentiment. In the last 30 days, BTC has exhibited a correlation exceeding 0.65 with the Nasdaq 100, highlighting its significant equity-like, high-beta behavior. In comparison, its relationship with gold remains around 0.20, emphasizing its separation from safe-haven movements.
Investor psychology
Sentiment indicators appeared positive, with the Fear & Greed Index positioned in the 65–70 range. Traders see this as “greed” without reaching euphoric levels, while institutions perceive BTC’s tight consolidation under USD 115,000 as potential energy for a surge. Positioning indicates patience: short-term traders aim for exits at USD 114,500–115,000, while long-term investors hold confidence in the face of supportive liquidity.
Outlook
The short-term perspective for Bitcoin stays somewhat optimistic. Maintaining above USD 112,000 allows buyers to remain dominant, and a rise past USD 115,000–115,250 confirms bullish momentum toward USD 120,000. On the other hand, a close below USD 112,000 may hasten a test of USD 110,000. For traders, the focus of the short-term strategy is to purchase dips around USD 112,000–112,500, aiming for profit-taking at USD 114,500–115,000. For investors, BTC remains an attractive medium-term opportunity despite daily fluctuations, bolstered by macro liquidity and strong on-chain trends.
Ethereum (ETH) deep dive

Ethereum continues to be the leading smart contract platform and the second-largest cryptocurrency by market cap, with today’s trading showcasing its persistent struggle between consolidation and breakout efforts. On September 22, 2025, ETH was priced around USD 4,200–4,320, experiencing intraday fluctuations that reached a peak of USD 4,365 and a low of USD 4,180. This price movement underscores ETH’s consolidation below a persistent resistance level at USD 4,380, which has constrained the market for multiple sessions. The consistent refusal at this level highlights that buyers require more powerful incentives to drive ETH into elevated ranges.
Technical structure
From a technical perspective, Ethereum is consolidating in a typical compression formation. On the daily chart, the USD 4,275–4,280 range acts as short-term support, capturing several intraday declines. Should this level hold, ETH’s framework stays positive, with possible gains reaching USD 4,500–4,650 upon a clear break past USD 4,380. In contrast, a failure to hold USD 4,275 paves the way to USD 4,200, and in a more negative scenario, USD 4,100.
Momentum indicators indicate a neutral to positive outlook. The daily RSI remains close to 54, indicating moderate strength while avoiding overbought conditions. The MACD histogram shows a small positive value, with the MACD line crossing above the signal line last week, indicating a developing bullish bias that is not yet validated.
Derivatives & market positioning
Open interest in ETH perpetual futures has increased slightly, indicating a resurgence in trader activity following a slow August. Funding rates remain close to neutrality, indicating that longs and shorts are fairly evenly matched. This arrangement is healthier than highly leveraged bullish positions, which frequently result in painful liquidations.
Options flows emphasize the market’s focus on the USD 4,500 strike, where call open interest has gathered. Traders continue to hedge in this area, which could lead to gamma-driven price spikes if ETH moves nearer to it. On the negative side, considerable put interest exists near USD 4,100, indicating that traders perceive this level as the probable support in case of a downturn.
On-chain & ecosystem dynamics
Ethereum’s on-chain fundamentals remain strong. Daily active addresses hover around 500,000, and gas fees have normalized following the volatility spikes from meme trading earlier this year. Layer-2 scaling solutions, particularly Arbitrum and Optimism, continue to absorb a growing share of Ethereum’s transaction load, with combined daily transactions consistently exceeding mainnet activity. This demonstrates that Ethereum’s ecosystem is expanding horizontally, even when base layer fees remain moderate.
DeFi and NFT activities exhibit consistent, if not remarkable, expansion. The total value locked (TVL) in Ethereum-based DeFi protocols approaches USD 60 billion, highlighting ETH’s ongoing significance as the foundation of decentralized finance. In the meantime, Ethereum staking continues to be strong, with more than 27% of the supply currently staked. This diminishes circulating supply and offers structural support to ETH’s value, especially during phases of consolidation.
Macro alignment
Macro conditions continue to be a significant influence. The Fed’s latest 50 basis point reduction enhances liquidity conditions, generally benefiting risk-on assets such as ETH. Historically, ETH has demonstrated a greater beta to liquidity expansions compared to BTC, frequently excelling in bullish phases as traders shift towards smart contract platforms. Nonetheless, ETH often lags behind BTC in early corrections, as demonstrated in last week’s decline when ETH dropped further compared to BTC
Investor psychology
The mindset of investors regarding Ethereum shows careful optimism. Traders recognize ETH’s ability to initiate an altcoin surge if it surpasses USD 4,380, yet they remain mindful of the dangers associated with a setback at that point. The USD 4,500–4,650 zone is regarded as the upcoming attraction for gains, whereas the USD 4,100 support is seen as the safeguard. For investors with a longer horizon, the staking yield of ETH and the expansion of its ecosystem warrant maintaining positions despite short-term fluctuations.
Outlook
Ethereum’s near-term path depends on the USD 4,380 barrier. A close beyond this level would trigger momentum, with price objectives at USD 4,500 and USD 4,650, driven by derivatives positioning and technical validation. Failure, nonetheless, puts ETH at risk of retesting the USD 4,275 support, with heightened risks toward USD 4,100. Currently, ETH represents compression energy: when it resolves, the movement is expected to be significant.
Solana (SOL) deep dive

Solana has established itself as the high-performance blockchain often likened to Ethereum, due to its unparalleled throughput and robust developer activity. On September 22, 2025, SOL was priced around USD 225–230, with daily fluctuations reaching a peak of USD 236 and a low of USD 222. This range indicates persistent volatility, yet also demonstrates that buyers are firmly protecting crucial levels.
Technical structure
The USD 221–223 range is serving as structural support, consistently absorbing selling pressure over the past two weeks. Resistance groups between USD 235–236, which aligns with a multi-session rejection range. This establishes a traditional breakout pattern: SOL is confined between solid support and upper resistance.
On the daily chart, the 50-day exponential moving average is positioned around USD 218, closely matching support, while the 200-day EMA remains lower at USD 196. This alignment indicates that the medium-term trend continues to be positive, with pullbacks being strongly supported before larger retracements can occur.
Momentum indicators support this. The daily RSI stands at 59, indicating a bullish tendency but not reaching overbought levels, allowing for potential upward movement. MACD stays positive, although histogram bars have leveled off, indicating compression pending resolution.
Derivatives & positioning
Derivatives data confirms speculative interest in Solana remains elevated. Open interest across perpetuals is near multi-month highs, but funding rates have normalized after a mid-September spike. This points to robust participation without dangerous overcrowding of long positions.
Options traders are aligning their positions around the USD 240 and USD 250 call strikes, indicating that the market perceives these levels as the next reasonable upside targets. Put positioning is concentrated around USD 210, indicating that traders consider it the likely support level in the short term.
On-chain & ecosystem dynamics
Solana consistently stands out in on-chain engagement. Daily transactions reliably exceed 20 million, significantly outpacing Ethereum’s base layer. Network stability, which was once Solana’s weak point, has significantly improved in 2025 due to updates to validators and enhanced scheduling. Disruptions that affected the chain in previous years have been limited, restoring trust among developers and users.
Growth in ecosystems is noticeable across various sectors. Solana leads NFT transactions beyond Ethereum, with platforms such as Magic Eden sustaining significant daily volumes. DeFi protocols on Solana, such as lending platforms and decentralized exchanges, collectively have over USD 8 billion in total value locked (TVL). Although it remains a small part of Ethereum’s DeFi ecosystem, this expansion highlights Solana’s reliability as a different center for decentralized finance
An additional important narrative is the increasing share of Solana in stablecoin transactions. Due to low transaction fees and high throughput, stablecoin transactions on Solana frequently exceed Ethereum’s daily volume, marking a significant step for adoption.
Macro alignment
Being a high-beta asset, SOL usually amplifies the movements observed in BTC and ETH. The Fed’s 50 basis point rate reduction creates a favorable environment for speculative risk assets, and Solana usually excels in such scenarios. Historically, when BTC increases by 5%, Solana frequently rises by 8–12%, indicating its sensitivity to general sentiment. In contrast, corrections affect SOL more severely; intraday drops of 10% frequently occur even if BTC falls by just 3–4%.
Investor psychology
Investor sentiment regarding Solana is clearly optimistic, although moderated by an understanding of its fluctuations. Numerous traders consider SOL to be the most appealing altcoin for bold positioning, due to its steady liquidity and sensitivity to macro trends. Long-term investors maintain their confidence, pointing to the expansion of Solana’s ecosystem, enhanced stability, and cultural uptake in gaming and NFTs. For these investors, declines into the USD 220–225 range represent chances to buy instead of triggering anxiety.
Outlook
A daily close exceeding USD 236 would likely generate momentum, aiming for USD 245 first, and possibly reaching USD 250 if upward movement increases. Conversely, a breach of the USD 221–223 support would weaken the bullish setup, revealing USD 210–205 as the subsequent defense area.
Currently, the setup benefits bulls. SOL is maintaining support, the positioning of derivatives is positive, and metrics in the ecosystem keep improving. Traders are closely observing the USD 236 breakout level, as surpassing this point could signal the beginning of Solana’s next upward movement in what has already been a robust year for the asset.
Cardano (ADA) deep dive

Cardano begins the September 22 trading session facing pressure while remaining within a defined range. ADA is valued at approximately USD 0.82–0.83, having decreased from the USD 0.90 level attained earlier this month. Market trackers like CoinMarketCap, TradingView, Coingecko, and Kraken align at the same low eighty-cent range, indicating that the retracement has stabilized for the time being. Sellers stay resolute at USD 0.90–0.905, whereas dip buyers are still entering the market between USD 0.82–0.84, forming a tight consolidation range.
Technical structure
On the daily chart, ADA is trapped between structural support and resistance above. The USD 0.90–0.905 range has limited gains several times, creating a solid barrier on momentum. The USD 0.82–0.84 range acts as immediate support; should this zone fail, the subsequent targets are USD 0.80 and then USD 0.78–0.79, where demand was last seen in late summer. If bulls succeed in regaining USD 0.905 with a daily close, momentum would probably push towards USD 0.96 and USD 1.02, which are both significant historical turning points. Momentum indicators stay neutral, with RSI in the mid-50s and MACD marginally positive yet steady, indicating that compression energy is accumulating.
Derivatives & positioning
Open interest in ADA perpetuals grew during the early September rally before declining as prices softened, a beneficial adjustment that lessens systemic risk from leveraged longs. Options positioning is uneven, with puts centered around USD 0.80–0.82, indicating perceived downside support, and calls concentrated between USD 1.00–1.05, showing hidden optimism if ADA rises. This arrangement suggests that traders are ready to pursue gains upon confirmation but are hesitant to overextend themselves before a definitive breakout.
On-chain & ecosystem
Open interest in ADA perpetuals grew during the rally in early September before declining as the price softened, a beneficial reset that lessens systemic risk from leveraged longs. Options positioning is tilted with puts concentrated around USD 0.80–0.82, indicating perceived downside support, and calls grouped around USD 1.00–1.05, suggesting underlying optimism if ADA moves upward. This arrangement suggests that traders are ready to pursue gains upon confirmation, but are hesitant to overextend themselves prior to a definitive breakout.
Macro alignment
The broader context continues to influence ADA’s path. The Federal Reserve’s 50 basis point rate reduction in early September enhanced the liquidity environment, generally favorable for risk assets. Nonetheless, fluctuations in the equity market caused an exaggerated decline in crypto, with ADA experiencing a steeper drop than BTC or ETH. Historically, ADA usually moves in a second-wave pattern: Bitcoin stabilizes, Ethereum regains resistance, and subsequently, Cardano advances towards its own breakout points. Provided BTC maintains between USD 112,000–113,000 and ETH surpasses USD 4,380, ADA’s chances of recovering USD 0.905 increase.
Investor psychology
Investor sentiment towards ADA is neutral, characterized more by patience than strong belief. Traders are pleased to take positions on both sides of the current range, selling around USD 0.90 and purchasing near USD 0.82–0.84, while anticipating a clear move to establish trend alignment. Long-term investors constantly highlight ADA’s staking functionality and steady development, frequently viewing drops to the low eighty-cent range as chances to acquire more. The lack of euphoria maintains relatively tidy positions, lowering the chances of major liquidation cascades.
Outlook
Cardano’s near-term trajectory hinges on resolution of its narrow range. A daily close above USD 0.905 would confirm a breakout and likely unleash momentum toward USD 0.96–1.02. Conversely, failure to defend USD 0.82–0.84 risks a slide to USD 0.80 and possibly USD 0.78–0.79. Until either side breaks, ADA remains compressed, mirroring the indecision of the broader crypto market. Patience and tactical execution remain essential, as the eventual move is likely to be sharp and decisive.
XRP deep dive

Market overview
XRP begins trading on September 22 just under the USD 3.00 psychological mark, staying within a tight range following several intraday rejections exceeding that point.This range indicates a market halting at a key turning point, solidifying profits after a robust performance earlier in the month. Market participants continue to concentrate on whether XRP can transform USD 3.00 from resistance into lasting support, a significant psychological and technical milestone.
Technical structure
The technical configuration is clearly outlined. The USD 3.03 mark has become immediate resistance; the price has attempted breakouts there several times but has failed, highlighting it as the key breakout point. A successful daily close above USD 3.03 would probably enhance upward momentum toward USD 3.20–3.30, a region where historical resistance has consistently emerged. On the negative side, USD 2.91–2.95 serves as important near-term support. If XRP breaks below this range, the chart clears the way for a further decline toward USD 2.85–2.88, levels that buyers had previously supported. Under that, USD 2.80 appears as the subsequent boundary. Indicators stay neutral, as RSI sits around 56 and MACD shows slight positivity, suggesting consolidation rather than fatigue.
Derivatives & positioning
Open interest in XRP perpetuals stays high yet steady, indicating that traders are engaged without excessive leverage. Funding rates are balanced, indicating a state of equilibrium between long and short positions. On the negative side, puts are focused near USD 2.85, strengthening its position as a regarded safety net. In general, the derivatives market shows a landscape where traders are hesitant to make strong preemptive moves before a clear breakthrough above or below the existing range,
On-chain & ecosystem
XRP remains active in trading amidst Ripple’s continual worldwide growth in payment systems. In recent months, there has been an increase in RippleNet integrations, especially within Asia-Pacific corridors, boosting hope regarding practical applications. On-demand liquidity (ODL) flows are still expanding, as Ripple partners handle rising transaction volumes utilizing XRP networks. Although this adoption does not instantly result in significant price fluctuations, it establishes a basis of consistent demand that supports sustained confidence in the asset over time. XRP transaction throughput on-chain stays robust, with uniform settlement speeds and minimal costs setting it apart from rivals.
Macro alignment
XRP serves as a cross-border payments token linked to institutions, positioning itself within a hybrid niche in the cryptocurrency ecosystem. It reacts to both general risk sentiment and utility-based movements. The Fed’s 50 basis point rate reduction enhances liquidity conditions, indirectly aiding speculative crypto movements, while XRP also gains from fiat-to-crypto corridor transactions amid increased capital mobility. In contrast to BTC and ETH, XRP frequently shows a weaker direct correlation with stocks while exhibiting a stronger link to emerging market currency movements. This distinct alignment offers diversification, yet complicates short-term trading, as price influencers reach beyond the usual macro-to-crypto pathway.
Investor psychology
Investor sentiment regarding XRP stays wary yet open to opportunities. The community is very engaged, frequently viewing macro adoption news as immediate bullish triggers. Simultaneously, traders recognize that XRP’s technical path relies on overcoming the USD 3.00–3.03 resistance. Long-term holders maintain their confidence, pointing to Ripple’s network growth as proof of the asset’s future global significance, whereas short-term traders concentrate solely on the breakout versus breakdown scenario.
Outlook
XRP’s short-term perspective hinges on breaking its limited trading range. A rise above USD 3.03 would validate bullish dominance and probably push the token towards USD 3.20–3.30, where momentum could gain strength if derivatives hedging activity boosts upward movement. On the other hand, not maintaining USD 2.91–2.95 would subject the token to a trial at USD 2.85–2.88, with the danger extending to USD 2.80 if selling accelerates. As long as none of these levels break, XRP will keep trading in a range, reflecting uncertainty in the wider crypto market. Traders need to monitor closely for volume surges at the boundaries of this band, as they are likely to offer the initial indications of resolution.


