- Bitcoin (BTC) remains steady near USD 123.5K, with USD 125.5K–126K acting as the critical level for a surge towards USD 127.5K–130K.
- Ethereum (ETH) is stabilizing above USD 4,500; holding this level keeps USD 4,650–4,800 in view, whereas slipping below USD 4,380 endangers a drop to USD 4,200.
- Solana (SOL) is currently confined within a USD 221–223 support range and a USD 235–236 resistance level; a breakout aims for USD 245–250, while a breakdown could lead to risks of USD 210–205.
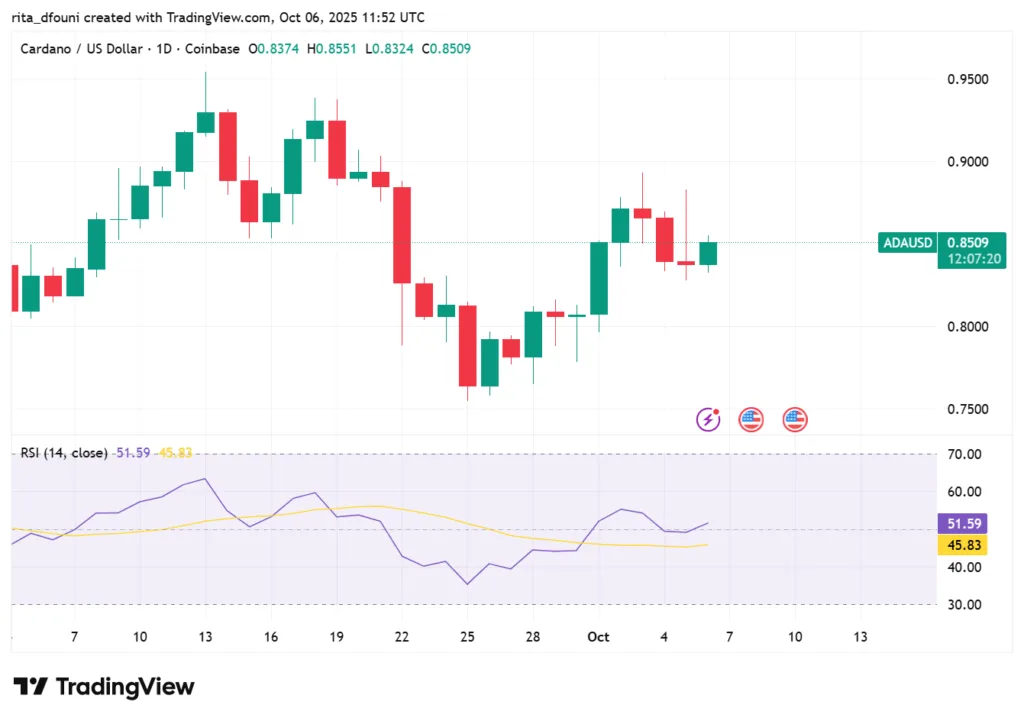
- Cardano (ADA) persists in its trading range of USD 0.82–0.84 and USD 0.90–0.905; breakout leads to USD 0.96–1.02, while a breakdown points to USD 0.78–0.80.
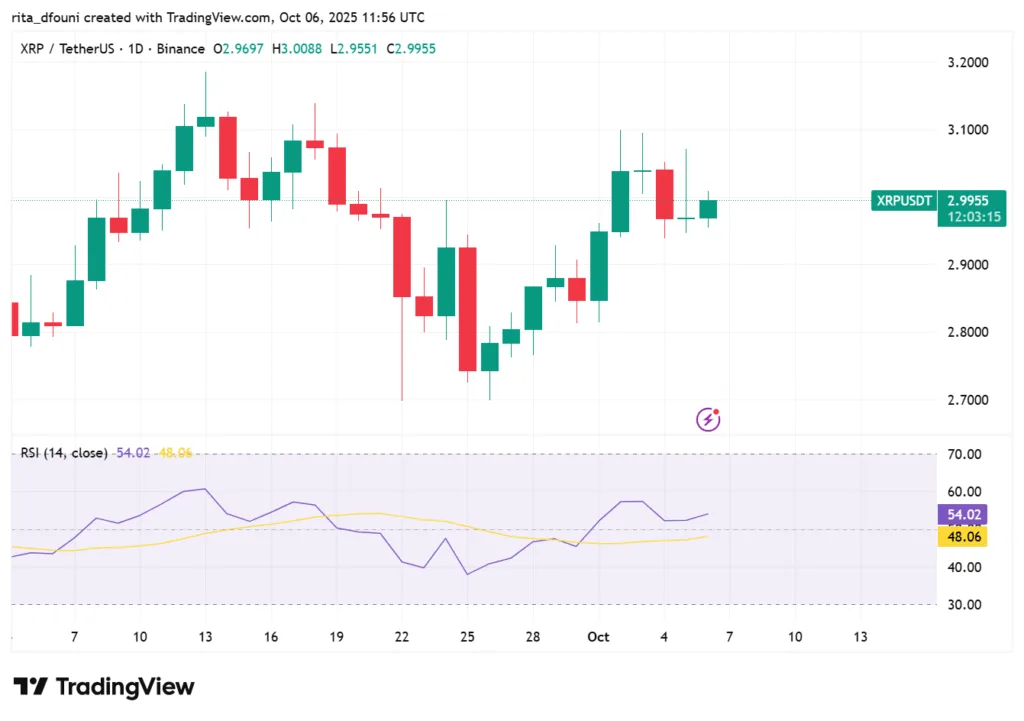
- XRP remains attracted to the USD 3.00 mark; a daily close above USD 3.03 may lead to USD 3.20–3.30, whereas a drop below USD 2.91–2.95 reveals USD 2.85–2.88.
Bitcoin (BTC) Deep Dive
Technical structure
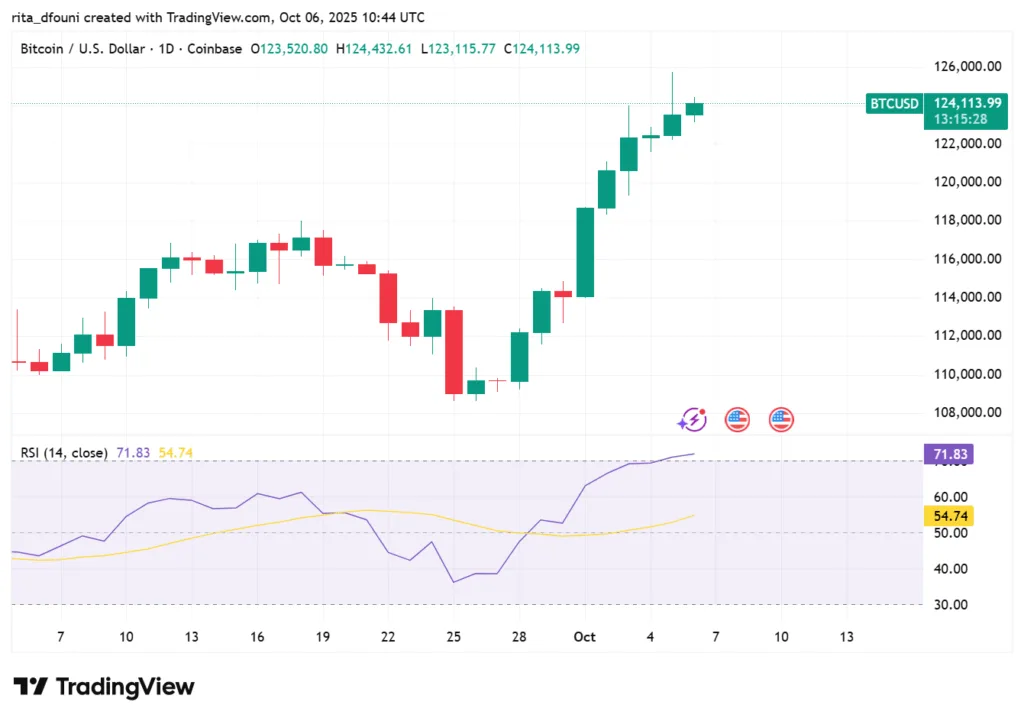
Bitcoin’s price stands at USD 123,497, fluctuating between USD 125,332 and USD 122,521 during the day. The chart indicates a significant rebound from crucial support in the USD 121,500–122,000 range, with buyers maintaining dominance following a prior pullback. The resistance point is situated within the USD 125,500–126,000 range. A persuasive daily close above that range would lead to USD 127,500 → USD 130,000. Conversely, if support fails, targets revert to USD 120,000 and further into USD 118,000.
Moving averages show the trend maintains an upward tendency. The 50-day and 100-day EMAs are rising and serving as dynamic support during medium-term pullbacks. That being noted, volatility is high, making the price more susceptible to sudden fluctuations instead of steady movements in this environment.
Derivatives & positioning
Open interest in perpetuals has increased with the rally, yet funding rates stay moderate with no indications of excessive one-sided leverage. Call options for strikes between USD 125,000 and 130,000 are attracting greater interest, indicating that many anticipate continuation. The buildup of protective puts in the USD 120,000–122,000 range indicates that downside hedging is currently taking place. The configuration permits a squeeze as additional momentum comes in.
Newsletter
Get weekly updates on the newest crypto stories, case studies and tips right in your mailbox.
On-chain & ecosystem
On-chain information supports the price movement. Active address totals stay high, while metrics for transaction volume and fees indicate steady network utilization. Miner accumulation (or at least a delay in selling) persists, indicating assurance in maintaining inventory. Long-term holders have retained a significant portion of their assets, restricting supply disruptions from that group. All indicators suggest that demand pressure will outweigh supply in the short term.
Macro alignment
Bitcoin’s surge closely corresponds with the overall risk appetite in the market. The larger markets are processing uncertainties regarding U.S. fiscal policies, interest rates, and worldwide liquidity. With favorable conditions in equities and credit, the influx into crypto persists. Numerous analysts refer to this situation as a “debasement trade,” where investors seek tangible assets and alternative value stores in response to inflation and dollar decline. BTC’s capacity to remain above USD 125K will serve as a crucial gauge for speculative risk
Investor psychology
Emotions are intensifying. There is no sign of extreme greed or panic; instead, a sense of measured optimism appears to dominate. Institutional participants have gained greater visibility, particularly through ETF inflows, boosting confidence in upward trends. Retail typically moves through these phases, thus price strength and volume will dictate how much additional capital flows in. The purchase of dips indicates belief that the current trend is not finished yet.
Outlook
The future movement of BTC depends on its ability to convert the USD 125,500–126,000 resistance level into support. Should that occur, anticipate a range of USD 127,500 to USD 130,000, with potential for further increases if momentum picks up. Should that zone not sustain, a revisit to USD 120,000 seems probable, with additional risk down to USD 118,000. Currently, the bias is still bullish, but stop levels must be close beneath the essential support zones to control risk.
Ethereum (ETH) deep dive
Technical structure
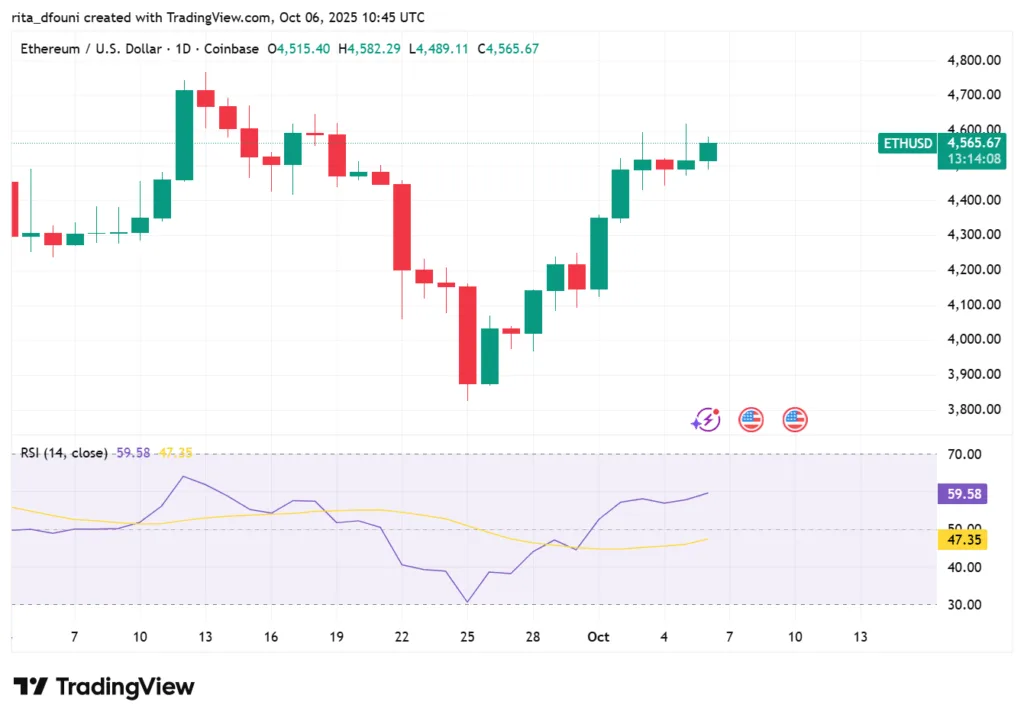
Ethereum trades at USD 4,520, after ranging between USD 4,613 (intraday high) and USD 4,480 (low). ETH has already cleared the critical USD 4,380 lid that capped progress in September, which shifts focus to whether it can hold USD 4,500 as a base. Above this level, upside targets open toward USD 4,650–4,800, with a secondary extension into USD 5,000 if momentum and flows sustain. On the downside, losing USD 4,420–4,380 would invalidate the bullish setup and send ETH back toward USD 4,250–4,200, where strong bids emerged earlier this quarter.
Momentum indicators indicate ETH is solidifying its strength. The RSI stays in a favorable range (mid-50s to low-60s), and EMAs are aligned positively, backing continuation as long as spot holds the USD 4,500 pivot.
Derivatives & positioning
Open interest in futures has increased, yet funding rates stay near neutral, indicating robust positioning without excessive long positions. Options traders are keenly pursuing USD 4,500–4,800 calls for October expirations, while downside coverage is centered around USD 4,200. This skew shows an expectation of potential gains while maintaining a traditional hedging approach when the market approaches resistance levels.
On-chain & ecosystem
Ethereum’s fundamentals underpin the technical resilience. Staking continues to rise, with a significant share of supply locked in validators, reducing circulating float. L2 adoption remains a bright spot Arbitrum, Optimism, and Base collectively process more daily transactions than mainnet, providing cost-efficient scaling without undermining ETH’s role as settlement layer. DeFi total value locked (TVL) has stabilized at multi-month highs, with ETH dominance in DeFi liquidity reinforcing its anchor role. Network fees are manageable, keeping user activity sticky across both DeFi and NFT sectors.
Macro alignment
ETH’s performance showcases its dual role: as a high-beta risk asset and a token that generates yield through infrastructure. The recent dovish changes in global central bank policy, particularly the rate cuts in the U.S., are beneficial for speculative assets. Concurrently, ETH’s staking yield narrative frames it as a semi-yield asset in investors’ portfolios. This dual characteristic might clarify why ETH has remained more resilient than numerous altcoins during periods of volatility, with macro movements initially directing funds into BTC and ETH before affecting wider tokens.
Investor psychology
Investor sentiment continues to be positive yet cautious. Traders view ETH as the most straightforward follow-up option after BTC, due to its substantial liquidity and clearly communicated resistance levels. The story of “ETH regaining dominance” emerges whenever the spot price holds steady above USD 4,500. Institutions seem to favor ETH exposure as a hedge alongside BTC, especially with ongoing ETF speculation. Retail, on the other hand, leans towards the psychological USD 5,000 threshold as the upcoming target.
Outlook
ETH stands at a crucial crossroads. Maintaining USD 4,500 sustains upward momentum, targeting USD 4,650–4,800 next, while USD 5,000 is possible if trading volume increases. Not maintaining USD 4,420–4,380 threatens to push ETH into a further decline towards USD 4,200. Currently, ETH is showing a bullish inclination, but with potential compression, the upcoming significant breakout or rejection will determine the direction for October.
Solana (SOL) deep dive
Source:TradingView
Technical structure
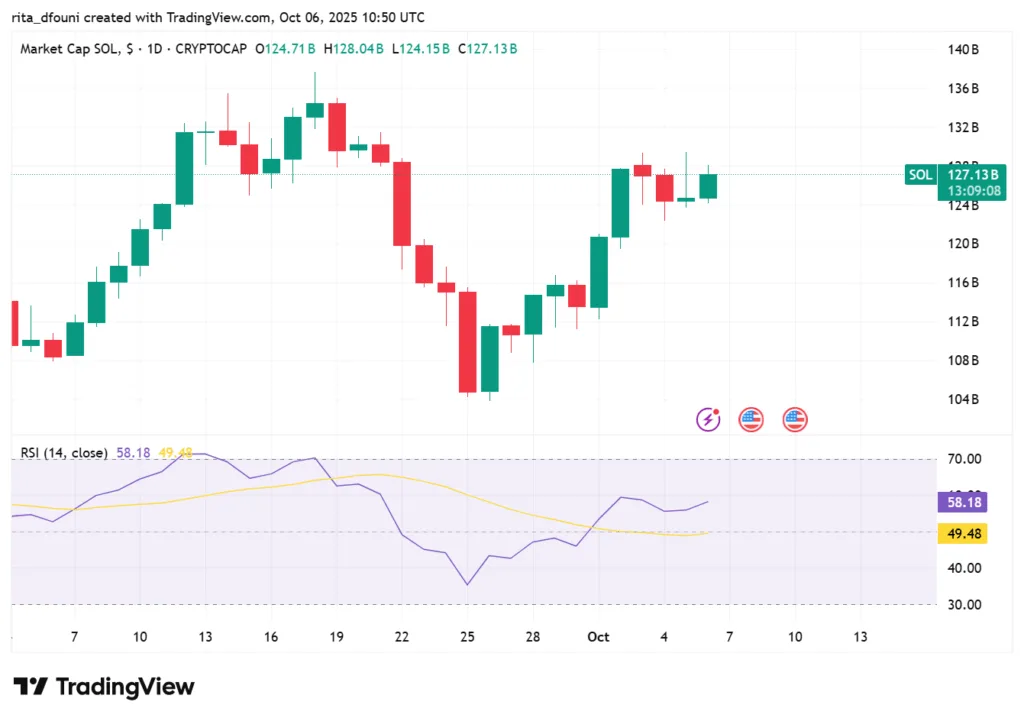
Solana remains between USD 231–233 following a daily variation of USD 236–237 (offers returned) and USD 226–227 (dips absorbed). The range remains well established: USD 221–223 acts as structural support that has experienced multiple selling attempts since mid-September, while USD 235–236 serves as the resistance level constraining upward movements. A daily close above USD 236 would confirm range breakout and target USD 245, with a possible extension towards USD 250 on ongoing momentum. Conversely, a notable drop to USD 221–223 would interrupt the higher-low trend and likely trigger a test of USD 210–205, the demand area from late summer. Short to medium EMAs have stabilized, displaying a compression pattern rather than a trend; breakouts from these situations tend to happen quickly.
Derivatives & positioning
Perpetual funding stays mostly the same, and open interest is high but stable, indicating active participation without significant leverage on either side. This balance reduces liquidation risk amid typical variations and permits a directional rise once the spot confirms. Focus on options has shifted towards elevated strikes at USD 240 and USD 250 for upcoming expirations, consistent with a “chase on confirmation” strategy. Interest in puts is focused around USD 210, a logical hedge level that aligns with the nearest high-timeframe support. To sum up: traders are sticking to the range and prefer defined-risk positions until a distinct breakout occurs.
On-chain & ecosystem
Fundamentals continue to clarify why demand for dips quickly arises in the low-USD 220s. In 2025, the throughput and reliability of the network remain strong thanks to enhancements in validators and schedulers; outages that were previously worrying have become rare. The range of activities is impressive: NFT marketplaces show substantial revenue, DeFi liquidity stays steady across AMMs and lending services, and user-focused applications (payments, gaming) keep drawing in users with smooth user experiences. During peak times, the settlement of stablecoins on Solana frequently rivals or exceeds that of other L1s, reinforcing its role as an effective payments network. These pillars don’t dictate the next candle, but they do illuminate current demand at support.
Macro alignment
SOL remains a conventional high-beta relay. When Bitcoin increases and Ethereum stays above USD 4,500, a quick shift to SOL typically happens, with percentage gains exceeding those of the major assets in the first move. The broader backdrop of a relaxed policy approach and fluctuating stocks keeps headline sensitivity elevated, indicating that confirming closures from BTC/ETH often act as the real trigger for SOL’s upward movements. In risk-off scenarios, the reverse occurs: SOL falls more sharply and sooner, which is why the USD 221–223 range serves as the market’s key barrier.
Investor psychology
Sentiment is undoubtedly positive about growth while remaining realistic about volatility. Investors with a long-term outlook emphasize improvements in dependability and ecosystem diversity; those with a short-term strategy appreciate SOL for its consistent movements when price ranges are breached. That blend creates a distinct pattern: serenity inside the limits, speed when layers give way. The absence of euphoric funding is advantageous since there are resources ready to invest upon verification rather than being forced to divest.
Outlook
The agenda for today stays unchanged. Provided that USD 221–223 holds, the outlook remains positive, aiming for USD 235–236. A daily close above USD 236 is anticipated to lead to USD 245, with USD 250 a possibility if the inflows rise. Fall to USD 221–223, and the market will likely investigate USD 210–205 to evaluate the demand beneath that range. As the majors move around their specific triggers, SOL’s main scenario entails continued compression with a bullish inclination; a definitive confirmation from BTC or ETH is the likely spark that will propel Solana’s range into a trending movement.
Cardano (ADA) deep dive
Technical structure
Cardano is exchanging in the USD 0.83–0.86 range after an intraday move that reached USD 0.88 at the peak and USD 0.83 at the lowest point. The framework continues to exhibit a clearly defined range: the USD 0.82–0.84 zone serves as the active support that has attracted several sell efforts since mid-September, whereas USD 0.90–0.905 is the ceiling that consistently hinders upward movement. A daily close over USD 0.905 would validate range resolution and lead to USD 0.96, with USD 1.02 being the next reasonable target where previous supply exists. A definitive close below USD 0.82 may lead the market to test USD 0.80, with increased risk of dropping further into the USD 0.78–0.79 range where summer consolidation happened. Short to medium EMAs are level and intertwined, indicating compression instead of a trend, so anticipate swift movements out of the range once a level is breached.
Derivatives & positioning
Positioning is equal. Perpetual funding remains stable, and open interest is high but not excessive, reducing the likelihood of chaotic liquidations during regular fluctuations. Interest in options is concentrated on USD 1.00–1.05 calls for near expiries, reflecting a typical “chase on confirmation” pattern, while protective puts are set around USD 0.80–0.82, corresponding with the closest significant support level. The distribution indicates that traders honor the range and favor defined-risk positions until a break is confirmed by the daily close.
On-chain & ecosystem
Cardano’s core principles prioritize stability instead of showiness. Developer engagement and governance improvements progress steadily, and staking retains a significant portion of ADA out of circulation, reducing downside momentum during risk-off phases. Participation in DeFi is still relatively low compared to Ethereum and Solana, yet it has shown resilience; the total value locked (TVL) has been gradually increasing throughout the quarter, which clarifies the persistent demand in the USD 0.82–0.84 range. The key point is not that on-chain metrics trigger a breakout, but that they bolster the demand when price returns to support.
Macro alignment
ADA’s tape stays connected to the major players and the overall macro context. The policy direction remains supportive of liquidity, yet stock markets are volatile and headline risks continue. In practice, ADA often acts as a second-wave player: Bitcoin’s strength beyond its resistance level and Ethereum’s stability above USD 4,500 usually come before ADA’s efforts to surpass USD 0.905. If BTC/ETH validate upward movement, alt breadth enhances and a shift towards quality L1s such as Cardano typically occurs; if major coins stagnate, ADA retreats to its compression range.
Investor psychology
Sentiment is calm instead of ecstatic. Range traders are selling into USD 0.90–0.905 and buying at USD 0.82–0.84, while momentum traders await a clear daily close for commitment. Long-term holders rely on staking rewards and steady ecosystem development, which maintains clean positioning and lowers the chance of cascading liquidations. The round-number appeal of USD 1.00 still shapes a positive sentiment, but buyers have remained cautious in seeking confirmation beforehand.
Outlook
The playbook is straightforward and unambiguous. Bullish trajectory: a daily close exceeding USD 0.905 confirms breakout criteria and probably speeds up to USD 0.96, with USD 1.02 as a follow-up as liquidity shifts to altcoins. Base scenario: sustained range activity between USD 0.82–0.84 support and USD 0.90–0.905 resistance until BTC/ETH generates the catalyst. Bearish trend: a significant drop below USD 0.82 reveals USD 0.80 and then USD 0.78–0.79, where buyers supported in late summer. With balanced derivatives, stable EMAs, and reliable support bids, ADA shows a minor bullish inclination within the range, but position sizing should be based on confirmation rather than speculation.
XRP deep dive
Technical structure
XRP is being exchanged slightly below the USD 3.00 mark, showing values of approximately USD 2.97–2.99 after fluctuating throughout the day between USD 3.07 (peak) and USD 2.95 (trough). The framework stays recognizable: USD 3.03 is the critical barrier, often attempted but not regained on a daily close. A confirmed close above USD 3.03 would activate upside targets toward USD 3.20–3.30. On the negative side, the USD 2.91–2.95 support persists in absorbing declines; breaching it would reveal USD 2.85–2.88, where demand last appeared in summer. Momentum indicators indicate equilibrium, with RSI hovering in the mid-40s to 50s, aligning with compression, while MACD histograms remain flat.
Derivatives & positioning
XRP’s derivatives landscape is active yet organized. Continuous open interest has remained stable, and funding rates are balanced, indicating no excess on either side. Options activity skews towards calls in the USD 3.00–3.20 range, indicating a desire for upward movement if the ceiling is breached, while protective hedging is positioned around USD 2.85–2.95. Traders are preparing for a resolution but favor defined-risk strategies until the spot confirms.
On-chain & ecosystem
The usefulness of XRP underpins its strength. Payment corridors utilizing Ripple’s network maintain consistent settlement volume, highlighting a demand that is not exclusively reliant on speculative activities. Costs stay minimal, and finality stays quick, supporting XRP’s role in remittances and liquidity-on-demand solutions. This baseline activity clarifies the continuation of bids in the USD 2.90s even as speculative confidence diminishes.
Macro alignment
XRP follows the same overarching trends affecting major liquidity policies, stock market fluctuations, and shifting investor perceptions. Nevertheless, XRP frequently trails BTC and ETH in confirming breakouts, with uptrends proving to be more sustainable once the major cryptocurrencies have already moved higher. Should BTC remain above USD 125K and ETH stay at USD 4,500, the likelihood of XRP surpassing USD 3.03 rises considerably. On the other hand, when major trends slow down, XRP often returns to a state of compression instead of initiating a separate breakout.
Investor psychology
Sentiment is carefully hopeful. Traders are monitoring the USD 3.00 level intently, yet discipline prevails: unless there is a daily close above USD 3.03, profit-taking leads to temporary spikes. Long-term investors highlight XRP’s payment functionality and its integration in real-world scenarios as justifications for maintaining their holdings amid fluctuations, whereas short-term traders view it as a vehicle for range trading until the trigger point is breached.
Outlook
XRP’s short-term outlook is twofold. Bullish scenario: a daily close over USD 3.03 would ignite momentum towards USD 3.20–3.30, driven by options hedging and breakout activity. Base case: ongoing compression within the USD 2.91–2.95 support and USD 3.00–3.03 resistance range until major players give the signal. Bearish trend: a drop to USD 2.91–2.95 reveals support at USD 2.85–2.88, where demand stability will be assessed. The situation benefits patient traders who ought to wait for confirmation instead of assuming it.


