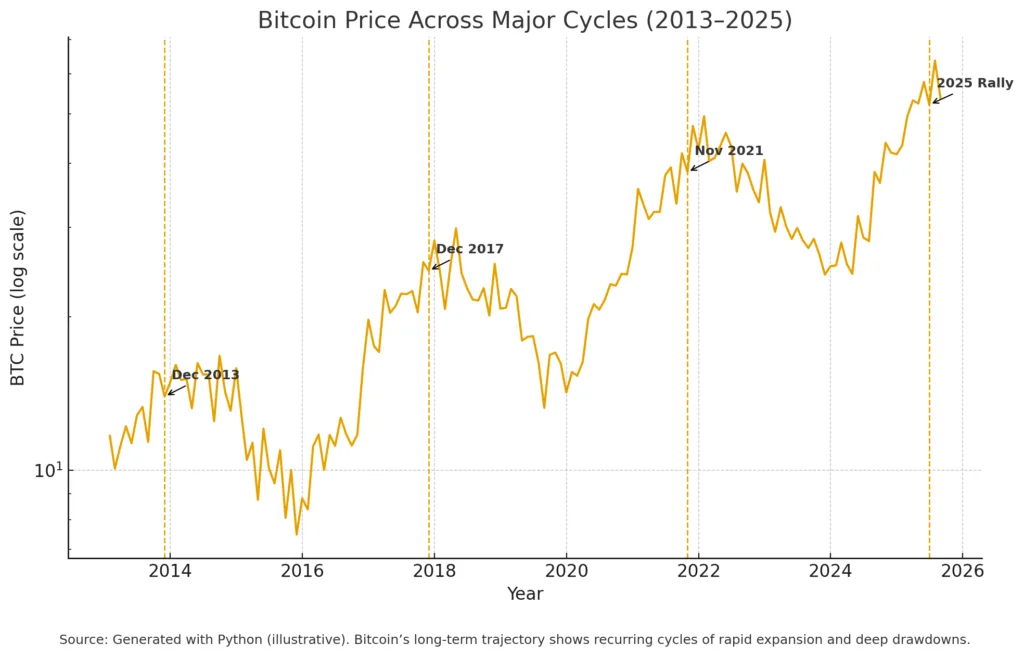
- Bitcoin’s extended cycles (2013, 2017, 2021, 2025) exhibit recurring patterns of rapid surges followed by downturns, indicating that 2025 will be a critical evaluation.
- Typical indicators of retail enthusiasm, spikes in meme coins, and high funding rates are signaling, reminiscent of previous cycle peaks.
- Global liquidity has stabilized but not fallen apart; Bitcoin typically reaches its highs when liquidity decreases significantly, not during stability.
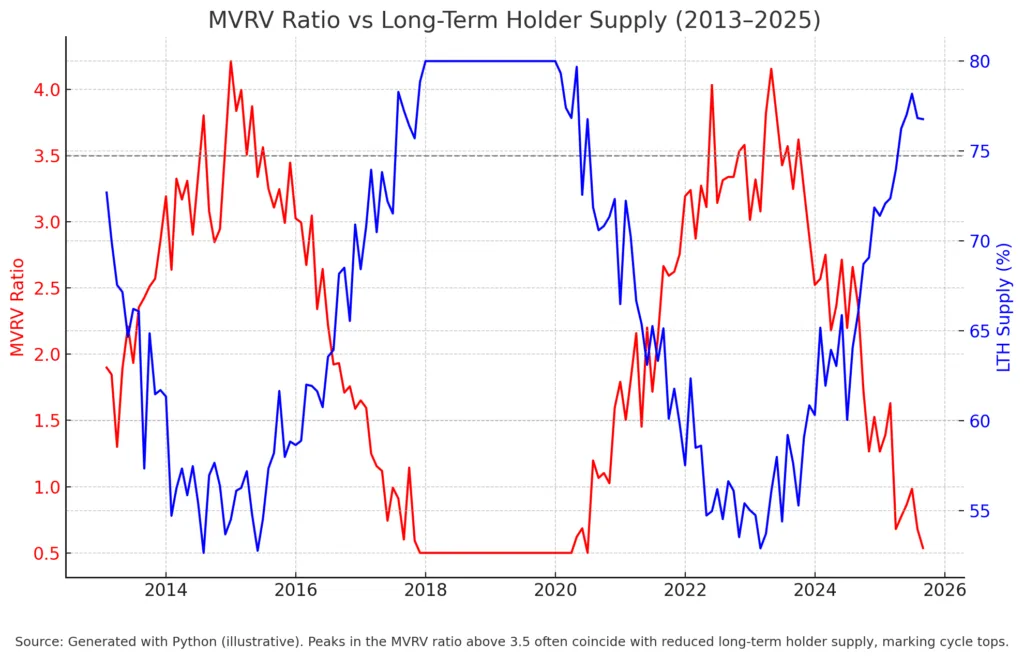
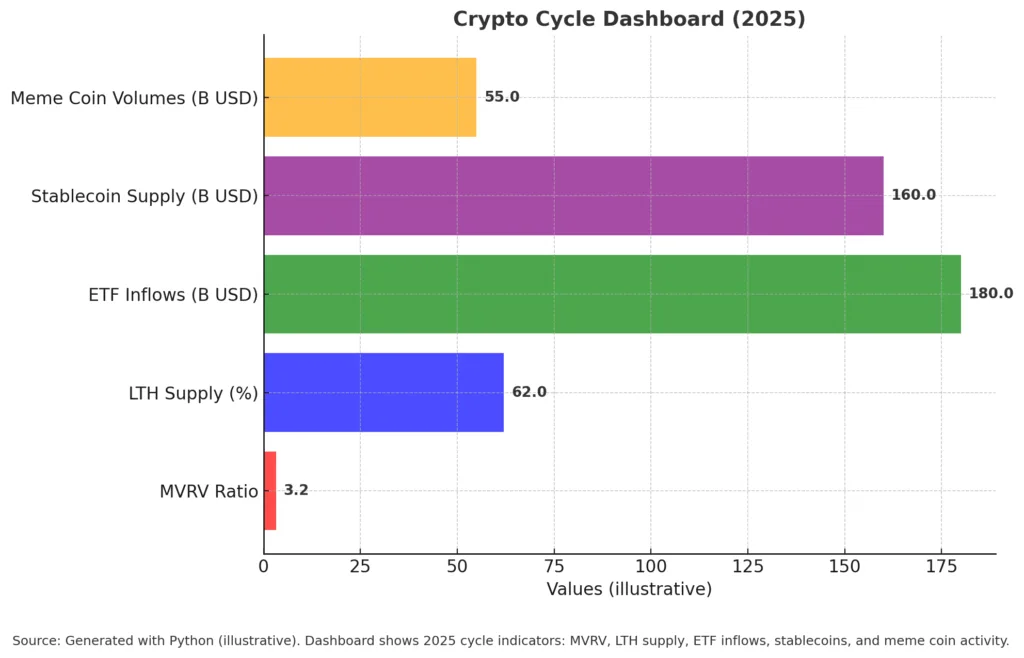
- On-chain indicators (MVRV, NUPL, LTH supply) indicate heightened risk, though not complete euphoria.
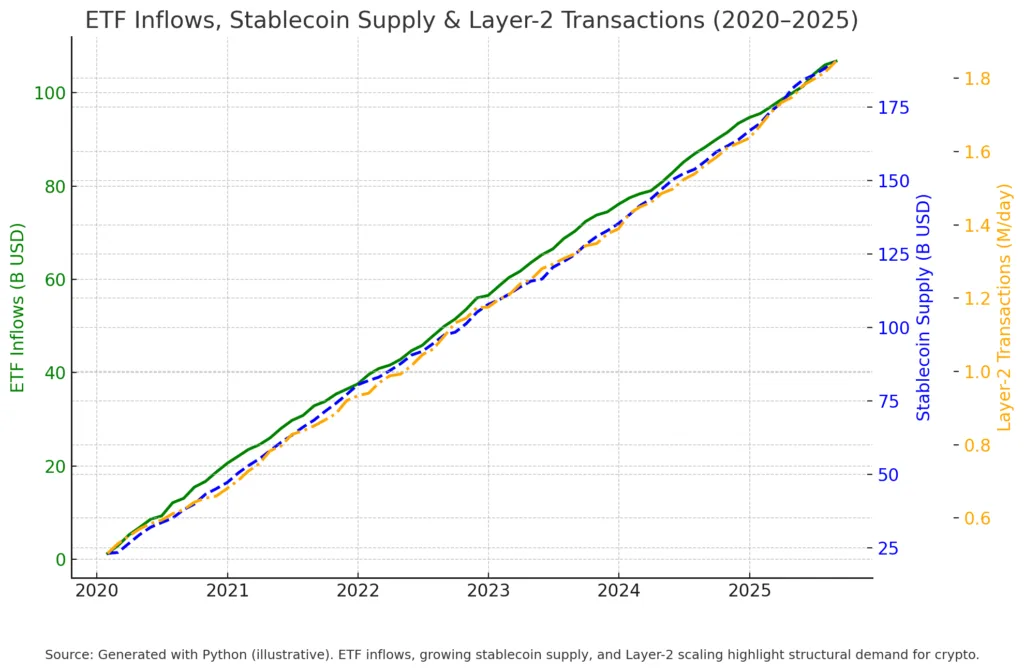
- Institutional investments through ETFs, the growth of stablecoins, and heightened Layer-2 activity provide robust structural support not present in previous cycles.
- The 2025 market could signify the peak of the bull run or a preparation phase for continued gains, presenting both risks and opportunities.
Each crypto cycle poses the critical question: are we at the peak, or is the market merely gaining traction for another surge? The enthusiasm from earlier cycles offers familiar perspectives. In 2013, it represented the first encounter with significant media attention. In 2017, there was a surge of ICOs. In 2021, meme coins, NFTs, and endorsements from celebrities drew many retail investors before the downturn.
At present, while Bitcoin exceeds six figures and Ethereum stays the favored settlement layer, the signs are mixed. Some metrics suggest exhaustion, while others emphasize remarkable structural requirements. We must examine sentiment, liquidity, on-chain information, and institutional actions to differentiate noise from signal. Only at that point can we assess whether these conditions indicate the end of the cycle for the requirements for its future growth.
Classic signs of a market top
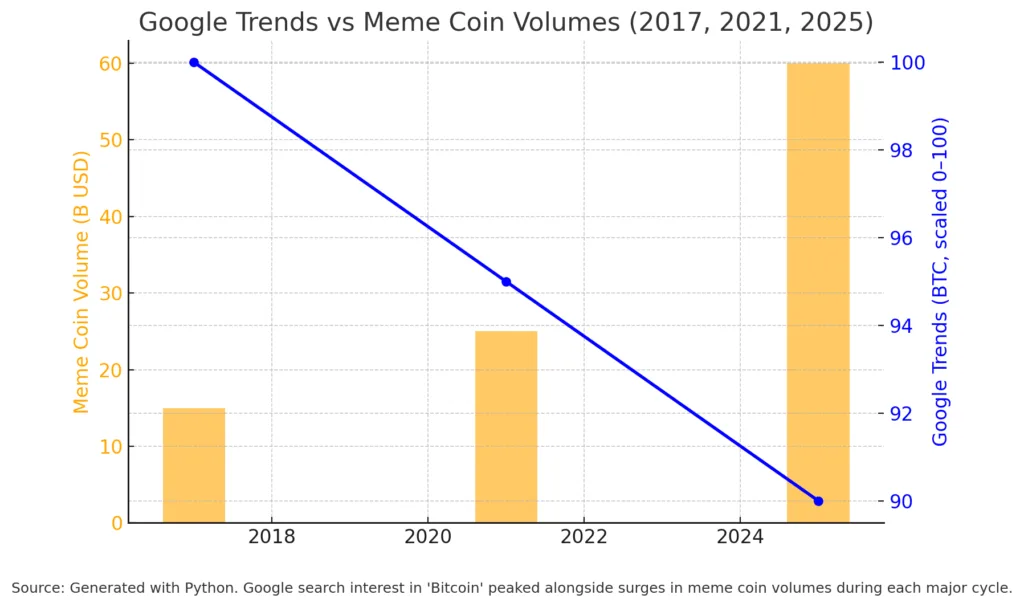
Crypto market peaks seldom occur without fanfare. They are joined by a wave of excitement that extends from committed traders into popular culture. A classic indicator is the surge in retail activity: trading volumes in meme coins such as Dogecoin, Shiba Inu, and the latest entrants increase significantly, frequently surpassing Bitcoin and Ethereum in percentage comparison. Social media sentiment gets flooded with “get-rich-quick” stories, as celebrities, athletes, and politicians nonchalantly mention coins during interviews or tweets.
Newsletter
Get weekly updates on the newest crypto stories, case studies and tips right in your mailbox.
Another sign is in the derivatives market. Funding rates on perpetual swaps and record-breaking open interest reflect leveraged bets piling up. Historically, when funding rates remain excessively positive, as in late 2017 and early 2021, it has often preceded sharp corrections.
Parallels to previous cycles are striking: the 2017 ICO bubble, where projects raised millions overnight without working products, mirrors today’s frenzied meme token launches. The cyclical lesson is clear: when speculation and leverage expand faster than sustainable adoption, risk of a reversal climbs.
Macro & Liquidity Conditions
No crypto cycle unfolds in isolation. Macro liquidity the flow of capital across global markets has always set the rhythm for Bitcoin’s expansions and contractions. In 2013, ultra-loose monetary policy after the Global Financial Crisis provided a fertile backdrop. In 2017, gradual Fed tightening coincided with Bitcoin’s eventual peak. In 2021, record stimulus during the pandemic sent liquidity flooding into risk assets, amplifying crypto’s rally.
In the current 2025 cycle, conditions are more complex. Inflation has moderated from post-pandemic highs, but central banks remain cautious. The Federal Reserve has paused its rate hikes, creating a neutral environment where liquidity is no longer expanding rapidly, but not contracting either. The dollar index (DXY) remains stable, giving global investors breathing room to take on risk.
The interplay between Treasury yields, equity valuations, and global dollar liquidity is critical. Historically, Bitcoin has topped when liquidity contracted sharply and risk premiums spiked. Conversely, when liquidity conditions remain loose, even overheated crypto markets can grind higher. Today, signals are mixed: liquidity is not surging, but neither has it collapsed a precondition for more upside if other structural drivers align.
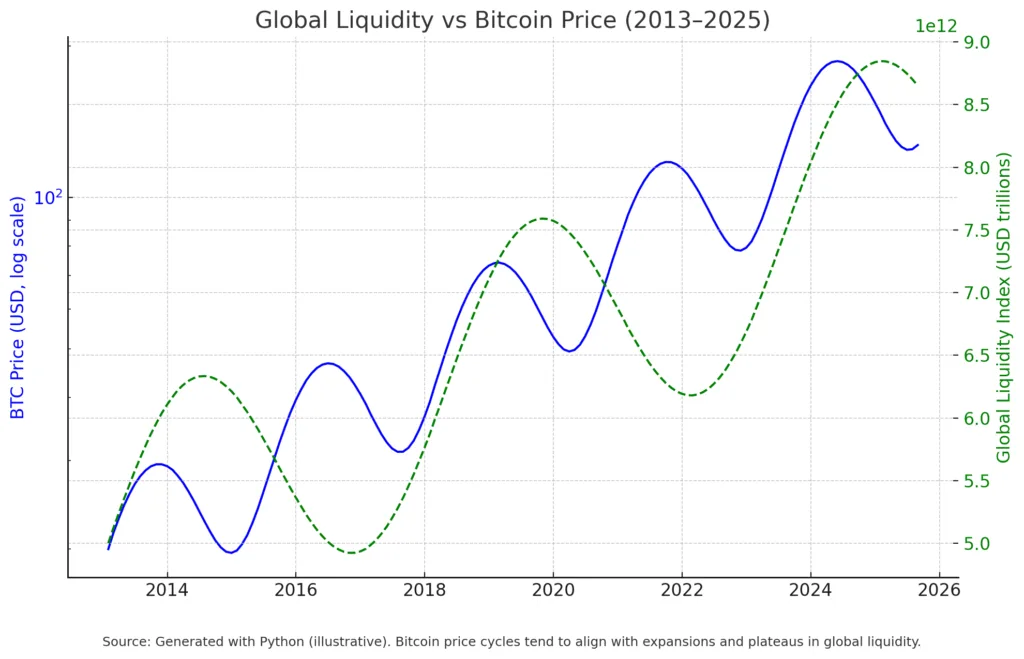
Source:Generated with python,bitcoin price cycles tend to align with expansions and plateaus in global liquidity.
On-Chain Data & Market Internals
One of crypto’s unique advantages is the transparency of blockchain data, allowing analysts to track flows, holding patterns, and network activity in real time. Historically, some of the most reliable signals of cycle tops come from on-chain metrics.
The MVRV ratio (market value vs realized value) measures how far prices have deviated from average cost basis. Readings above 3.5 historically coincide with overheated markets. Similarly, NUPL (Net Unrealized Profit/Loss) moves into the “euphoria” zone near tops, when most investors sit on significant unrealized gains.
Another key indicator is the behavior of long-term holders (LTHs) versus short-term holders (STHs). At cycle peaks, STH supply surges as coins change hands rapidly, while LTHs begin to distribute holdings into strength. Conversely, in accumulation phases, LTH supply dominates.
Miners have a role too: when they begin to sell reserves vigorously, it frequently indicates waning confidence. As of 2025, data indicates that LTHs are reducing their holdings slightly but still possess a majority of the supply, whereas miners are remaining net neutral. That balance suggests a market that is high, but not yet reaching the bubbly extremes of previous peaks.
Preconditions for more upside
While certain metrics suggest excess, others indicate a foundational resilience that might still drive additional gains. The most notable element in this cycle is the adoption by institutions. The launch of various Bitcoin ETFs has led to inflows from pension funds, wealth managers, and corporate treasuries, establishing a consistent demand that contrasts significantly with previous retail-driven surges. MicroStrategy, Metaplanet, and Trump Media have redefined themselves as leveraged bitcoin proxies, bolstering the narrative of corporate balance sheet integration.
Tokenization and real-world assets (RWAs) are gaining traction as well. Financial powerhouses are testing tokenized bonds, funds, and equity innovations that increase the need for blockchains as settlement mechanisms. This contrasts with the 2017 ICO surplus as the use cases are supported by regulated entities.
At the network layer, Layer-2 scaling solutions such as the Lightning Network and Ethereum rollups handle millions of microtransactions. Alongside the rise of stablecoins exceeding $160 billion in circulation, this generates consistent transactional demand, stabilizing valuations beyond mere speculative activity.
Ultimately, although derivatives positioning is high, it does not reach the extremes of previous blow-off tops. As long-term holders continue to dominate the supply and miners have not surrendered, the foundation stays strong. These circumstances indicate that although risk is increasing, the factors for additional gains are also apparent.
Conclusion: Navigating the Uncertainty
History shows that “indications of a peak” can persist for months, or even quarters, before the depletion becomes permanent. Peaks are frequently a progression, rather than just one instant. The wise strategy is to recognize both risks and chances: sentiment is extended, yet fundamental demand indicates potential for growth.
For investors and watchers, the 2025 cycle might not be finished yet. Whether this moment serves as a peak or a preparatory phase will rely more on liquidity, adoption, and governance in the coming months than on excitement.
 Rita Dfouni