Bitcoin (BTC) deep dive
Technical structure
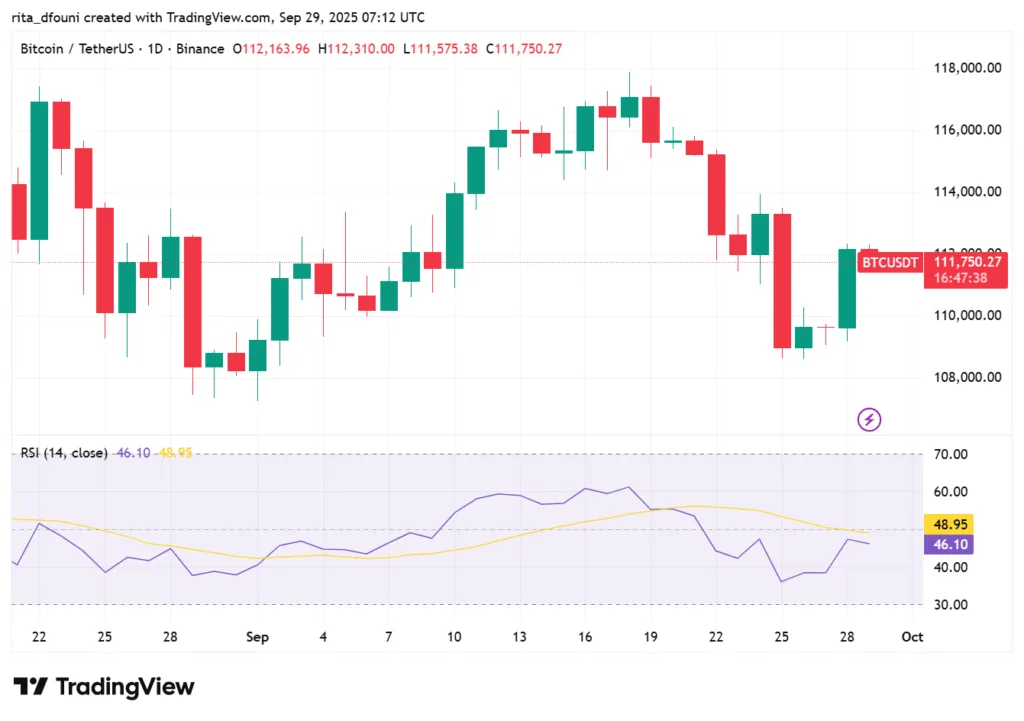
Bitcoin is currently priced at approximately USD 112,142.6, recovering from intraday lows near USD 111,674 – 111,766. Current price movements indicate BTC is stabilizing within a range, with resistance emerging around USD 113,000 – USD 113,250 and support gathering near USD 110,800 – USD 111,100. In the daily chart, the candle wicks indicate that sellers are still engaged at elevated levels, whereas dip buyers are entering close to support. If BTC breaks above USD 113,250 significantly, it may create the potential for a rise towards USD 115,000 – USD 117,500. On the other hand, not maintaining USD 111,000 could lead to a further pullback toward USD 109,500 – USD 110,000.
Moving averages indicate BTC is close to its mid-term trend lines: the 50-day EMA is leveling off, signifying diminished momentum, whereas the 200-day moving average is positioned lower, providing essential long-term support. The convergence of average lines around the center of the range emphasizes that BTC is coiling, poised for a trigger to move up or down.
Derivatives & positioning
Derivatives indicators suggest a careful equilibrium in market positioning. Open interest in BTC perpetual futures stays high but stable, indicating no significant surge, suggesting that many traders are maintaining their positions rather than actively increasing their stakes. Funding rates have decreased from their recent highs, indicating a reduction in speculative leverage. Options data suggests concentrations of call strikes near USD 115,000 and USD 120,000, showing that numerous players are wagering on further upward movement if BTC surpasses resistance. On the negative side, put interest increases significantly near USD 110,000, potentially serving as a mild buffer during any declines.
On-chain & ecosystem
From an on-chain viewpoint, essential metrics continue to be encouraging. Daily active addresses remain steady, and transaction volume is reliable, signaling ongoing usage at the foundational layer.Indicating that miners prefer to hold onto their assets rather than sell them aggressively, which reflects confidence in medium-term price stability. Long-term holders (individuals who have not moved their coins for over a year) maintain a significant share of the supply, decreasing the likelihood of a mass sell-off by legacy holders in times of volatility. Collectively, these on-chain patterns offer a shield against downward pressure.
Macro alignment
Bitcoin continues to be closely connected to global liquidity factors, particularly in the U.S. The Federal Reserve’s recent dovish stance, notably its interest rate reduction, acts as a supportive factor for risk assets. At the same time, capital movements in stocks and yields determine whether speculative capital re-enters crypto or withdraws. As conventional markets fluctuate during the session, BTC frequently acts as a high-beta asset, amplifying movement. The latest ETF outflows for Bitcoin and Ethereum experienced approximately USD 1.7 billion in redemptions, suggesting a cautious sentiment and reflecting potential institutional profit-taking or rotation.
Investor psychology
Sentiment seems varied, leaning towards careful hopefulness. Whales have been busy: recent data indicates they obtained around USD 3.3 billion in Bitcoin and USD 1.73 billion in Ethereum during the last week, suggesting significant accumulation. The Economic Times This investment from significant holders could boost confidence among retail and mid-sized investors. At the same time, fear-and-greed indicators remain in a neutral range, indicating that the market is neither overly optimistic nor profoundly anxious. The consolidation and absence of a significant breakout indicate that numerous traders are staying on the sidelines, awaiting confirmation before making bold investments.
Outlook
Bitcoin’s short-term path continues to be dependent. If BTC successfully surpasses USD 113,250 with robust volume, it probably paves the way to USD 115,000 – USD 117,500, with a possible extension towards USD 120,000 if momentum builds. Should it instead fall below USD 111,000, a retest of USD 110,000 or even USD 109,500 becomes more likely. The arrangement benefits bulls, as long as BTC remains above the lower support levels. Traders might seek entry points around USD 111,000 – USD 111,500 with tight risk management, while long-term investors see dips as potential accumulation areas, particularly considering miner and holder actions.
Ethereum (ETH) deep dive

Market overview
Ethereum is maintaining a stable bid following last week’s shakeout, trading within the USD 4,100–4,200 range today. Point-in-time prints group around USD 4,120–4,150, aligning well with daily reference data indicating USD 4,141.84 for today’s session. The tone is “consolidating near resistance” with buyers stepping in during dips, yet overhead supply continues to prevail just below the upcoming trigger zone.
Technical structure
Price remains constrained below a widely publicized ceiling at USD 4,350–4,380. That area limited earlier advances until late September and continues to be the key technical point: a conclusive daily close exceeding USD 4,380 would probably attract momentum towards USD 4,500–4,650. On the negative side, USD 4,275–4,280 serves as the initial support; if it breaks, USD 4,200 and subsequently USD 4,100 become relevant again. This map corresponds with levels that have been closely monitored by technical desks in recent weeks.
Derivatives & positioning
Futures open interest has steadily increased following mid-month de-risking, and funding remains close to flat, indicating that neither side is excessively over-leveraged. Options activity remains centered around USD 4,500 calls for upcoming expiries, while significant put interest is positioned between USD 4,100 and USD 4,200. That distribution suggests traders are ready to pursue if spot surpasses USD 4,380, but until that point, they favor defined-risk setups that adhere to the range.
On-chain & ecosystem
Beneath the surface, the fundamentals of Ethereum continue to favor consolidation over capitulation. The L2 stack persists in drawing activity away from the mainnet, resulting in controlled base-layer fees and more stable throughput compared to spring. Staking involvement continues to be strong, which systematically lowers the available supply and mitigates downward pressure during risk-averse periods. None of these data points invalidate the spot technicals, but collectively they clarify why dips towards USD 4,100–4,200 continue to attract buyers.
Macro alignment
The macro environment continues to favor liquidity. Following September’s policy change, mainstream analysts anticipate further easing through 2026, and recent discussions have highlighted that the Fed still has the capacity to cut as growth slows. Crypto has exhibited typical high-beta tendencies: a swift de-risking during equity fluctuations, succeeded by cautious dip-buying as interest rate sentiment eases. For ETH in particular, a mild rates trajectory maintains the route for a rise above USD 4,380, but stock risk and overall volatility may still postpone that moment.
Investor psychology
Feelings are tentatively hopeful. The sentiment brightened as whales increased risk among majors earlier this week, with reports indicating significant BTC and ETH accumulation; this story supports dips but hasn’t yet shifted the trend into euphoria. Traders continue to adopt a tactical approach: they regard USD 4,380 as the “prove-it” threshold and opt for confirmation before buying rather than taking on aggressive pre-positioning. Long-term holders rely on the staking/yield and overall ecosystem narrative, making USD 4,100–4,200 appear more like a “reasonable” consolidation instead of a threatening peak zone.
Outlook
ETH is merely one clean catalyst short of a resolution. Should spot surpass and settle above USD 4,380, dealer hedging at higher strikes and CTA-style momentum may propel the move toward USD 4,500, with USD 4,650 as a plausible follow-up target if the flows intensify. If buyers falter and USD 4,275 breaks, anticipate another attempt towards USD 4,200–4,100, where the market has shown readiness to re-enter. As long as none of those edges fail, the base scenario persists in compressing with constructive hints, with ETH functioning like a tightly wound spring under a clearly indicated cover.
Solana (SOL) deep dive
Market overview
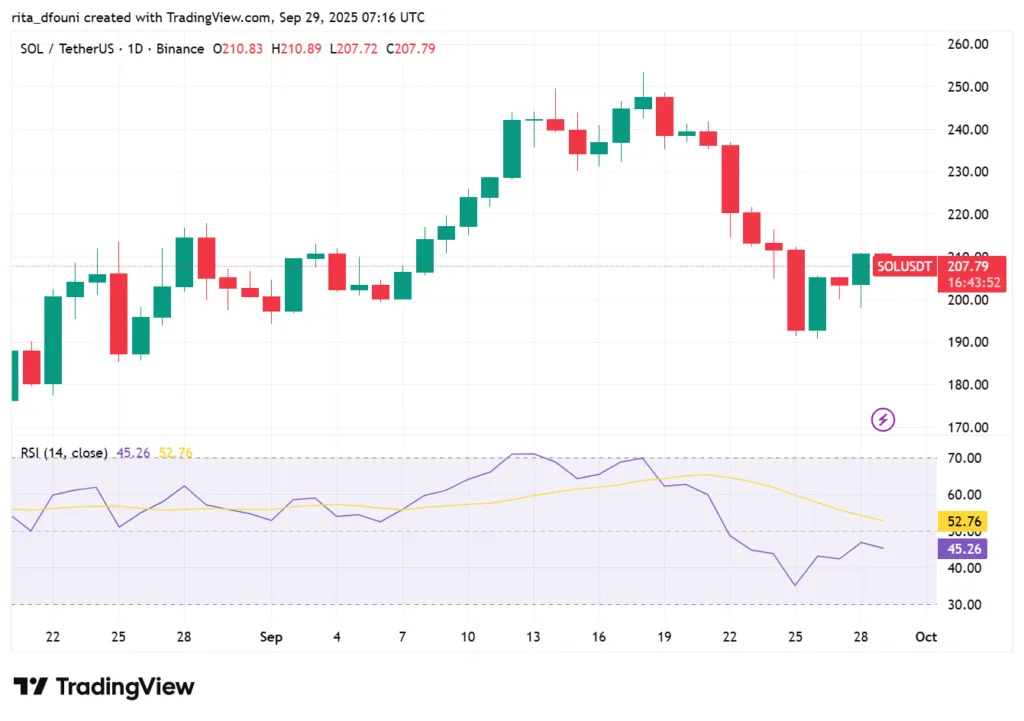
Solana is fluctuating in a vibrant yet regulated range today, maintaining the mid-USD 220s after a swift decline from the high-USD 230s that occurred earlier in the session. Intraday liquidity is still two-sided: buyers engage during minor pullbacks, whereas offers persist just below the previous rejection area. The general tone reflects the majors’ positive outlook, but there’s still a need for a stronger push from Bitcoin and Ethereum before making further gains.
Technical structure
The chart stays in a traditional box. Structural support persists in the USD 221–223 range, which has withstood several selling attempts in the last two weeks. Above, resistance is focused around USD 235–236, the level that limited the previous breakouts. A definitive daily close above USD 236 would validate range resolution and initiate a measured move toward USD 245, with a possibility to extend to USD 250 if momentum continues. Not maintaining USD 221–223 would disrupt the higher-low pattern and probably lead to a test of USD 210–205, the area where demand reemerged in late August. On the daily chart, SOL is positioned above its short and medium moving averages, which display a flattened appearance indicating compression rather than a clear trend, and this serves as a reminder that breakouts from these phases are typically abrupt.
Derivatives & positioning
Positioning has stabilized since the leverage purge in the middle of the month. Perpetual funding remains near unchanged, and open interest is high yet steady, a situation that allows for directional growth without the vulnerability of congested long positions. Interest in options has centered on upside strikes at USD 240 and USD 250, indicating a readiness to pursue if the spot surpasses resistance, while protective puts are stacked near USD 210, corresponding with the closest high-timeframe support on spot. The main point is clear: traders acknowledge the range and favor defined-risk strategies until a breakout allows them to act aggressively.
On-chain & ecosystem
Beneath the surface, Solana persists in demonstrating the qualities that have fueled its revival in 2025. Throughput continues to be high and stable, and the reliability enhancements implemented this year have minimized network disruptions, marking a significant change from prior cycles. The range of activities sets them apart: NFT marketplaces continue to experience high daily trading volume, DeFi liquidity remains stable in leading AMMs and lenders, while payment/consumer applications consistently attract users with seamless user experiences. Stablecoin transactions on Solana continue to shine, frequently matching or surpassing other L1s during active periods. None of these data points contradict the daily chart levels, but they illustrate why dip demand emerges swiftly when the price drops into the low-USD 220s.
Macro alignment
Being a high-beta alt, Solana often amplifies the movements of the major cryptocurrencies. The policy direction after the meeting continues to favor liquidity, which typically benefits risk assets; however, fluctuations in equities and sporadic ETF-flow disturbances still add sensitivity to crypto headlines. In reality, this implies that SOL’s most favorable upside scenarios generally begin with Bitcoin achieving a strong daily close above its resistance zone and Ethereum validating above its USD 4,380 ceiling. When this occurs, the switch to SOL often happens quickly, with percentage increases exceeding those of BTC and ETH in the initial phase of the movement.
Investor psychology
Sentiment regarding Solana continues to be positively growth-oriented while remaining aware of its volatility. Longer-term holders highlight the enhanced reliability, the variety of applications, and the cultural impact in NFTs and gaming. Short-term traders see SOL as an excellent option for directional exposure due to its clear trends following range breaks. That blend results in a recognizable behavior pattern: calmness inside the box, quickness outside it. The lack of euphoric positioning is a good sign that there is dry powder available to use if prices validate.
Outlook
Provided that USD 221–223 remains intact, buyer sentiment prevails, with the subsequent decision level at USD 235–236. A daily close beyond that level should enable USD 245, and if momentum builds, USD 250 becomes reachable with continued support. If USD 221–223 is breached, the market will probably assess USD 210–205 to evaluate the demand still present below that range. With majors reacting to their own triggers,the initial clear confirmation from BTC or ETH will probably be the catalyst that breaks Solana’s range in favor of a trend.
Cardano (ADA) deep dive
Market overview
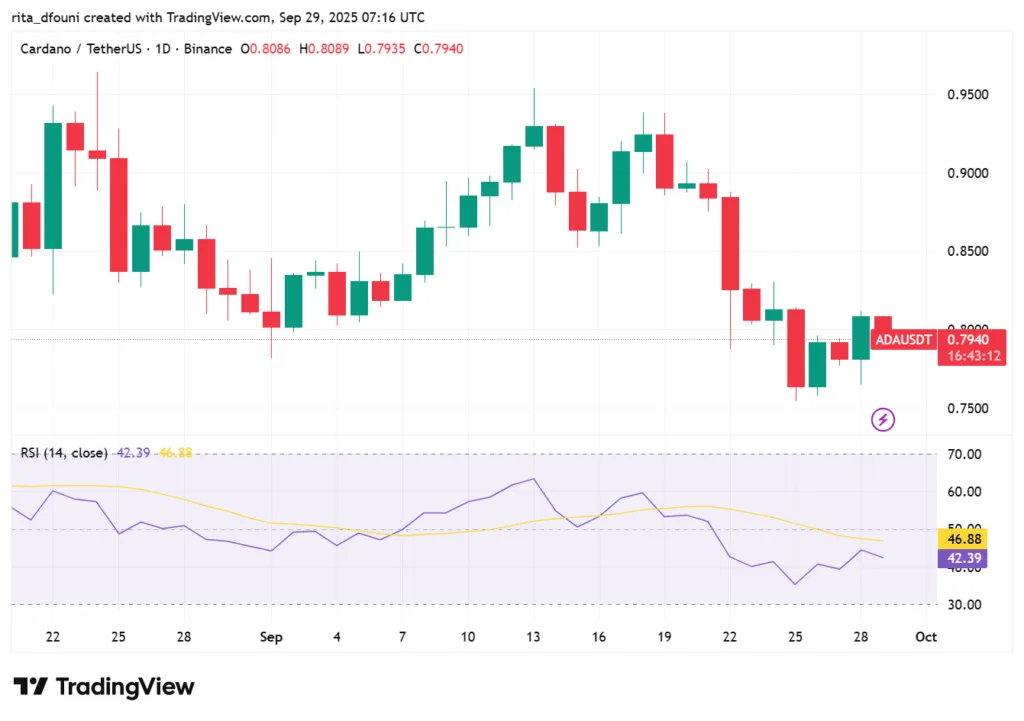
Cardano begins the September 29 session with price movement focused on the lower USD 0.80s, maintaining the range behavior that has characterized its September profile. Spot prices on major aggregators are concentrated around USD 0.82–0.84, significantly lower than the USD 0.90 level that was tested earlier this month. Sellers persist in maintaining overhead resistance as dip buyers consistently enter around the low 0.80s, keeping ADA confined within known limits.
Technical structure
On the daily chart, ADA stays trapped below the USD 0.90–0.905 resistance level. The market has declined this shelf on several occasions, establishing it as the short-term breakout pivot. The USD 0.82–0.84 range acts as essential short-term support. Should buyers fail to maintain this zone, the next demand test will be at USD 0.80, with additional risk moving to USD 0.78–0.79, where summer consolidation took place. A daily close above USD 0.905 would significantly change the sentiment, setting new upside targets at USD 0.96 and USD 1.02.
Derivatives & positioning
The derivatives landscape for ADA is stable. Open interest increased to early September highs but has since eased, reflecting the wider altcoin de-risking observed last week. Funding rates are balanced, indicating a state of equilibrium between buyers and sellers. Options open interest is concentrated on USD 1.00 calls, indicating reserved optimism, whereas puts near USD 0.80 imply traders are insuring against a potential revisit of lower support. The distribution strengthens the view of a market willing to smooth out extremes until a clear breakout establishes direction.
On-chain & ecosystem
Essentially, Cardano persists in demonstrating gradual progress instead of rapid expansion. Developer engagement stays steady, and governance enhancements advance systematically. DeFi usage on ADA remains limited in comparison to Solana or Ethereum, yet the total value locked is slowly increasing, reinforcing a gradual narrative of ecosystem resilience. This essential stability clarifies why the USD 0.82–0.84 range still draws interest. Long-term investors frequently highlight ADA’s staking and protocol development, viewing dips as chances to buy more.
Macro alignment
Like other fields of study, ADA’s conduct is closely linked to larger macroeconomic factors. This month’s rate cut by the Fed offered a liquidity cushion, but weak stock performance introduced headline risk that affected crypto. In reality, ADA generally trails behind Bitcoin and Ethereum in the initial stages of a rally and starts to gain momentum only after the major coins validate their breakouts. For ADA, this entails monitoring if BTC surpasses USD 113,250 and ETH crosses USD 4,380; if those levels are reached, ADA’s chances of exceeding USD 0.905 significantly increase.
Investor psychology
The sentiment among ADA holders reflects patience instead of strong belief. Traders are countering both extremes by selling close to USD 0.90 and buying around USD 0.82–0.84 as they anticipate a catalyst for resolution. Long-term investors persist in viewing ADA as a gradual investment in network evolution, staking returns, and ecosystem growth. This lowers the chance of a chaotic unwind, since the positioning does not have the excitement that comes before sudden liquidations.
Outlook
A close above USD 0.905 would trigger upward momentum towards USD 0.96–1.02, encouraging rotation flows from major currencies into premium altcoins. A breakdown of USD 0.82–0.84 leaves ADA vulnerable to another challenge at USD 0.80, with the potential decline reaching USD 0.78–0.79. Until either of these situations occurs, ADA remains constricted.Traders need to be patient since compression phases often culminate in sudden directional shifts.
XRP deep dive
Market overview
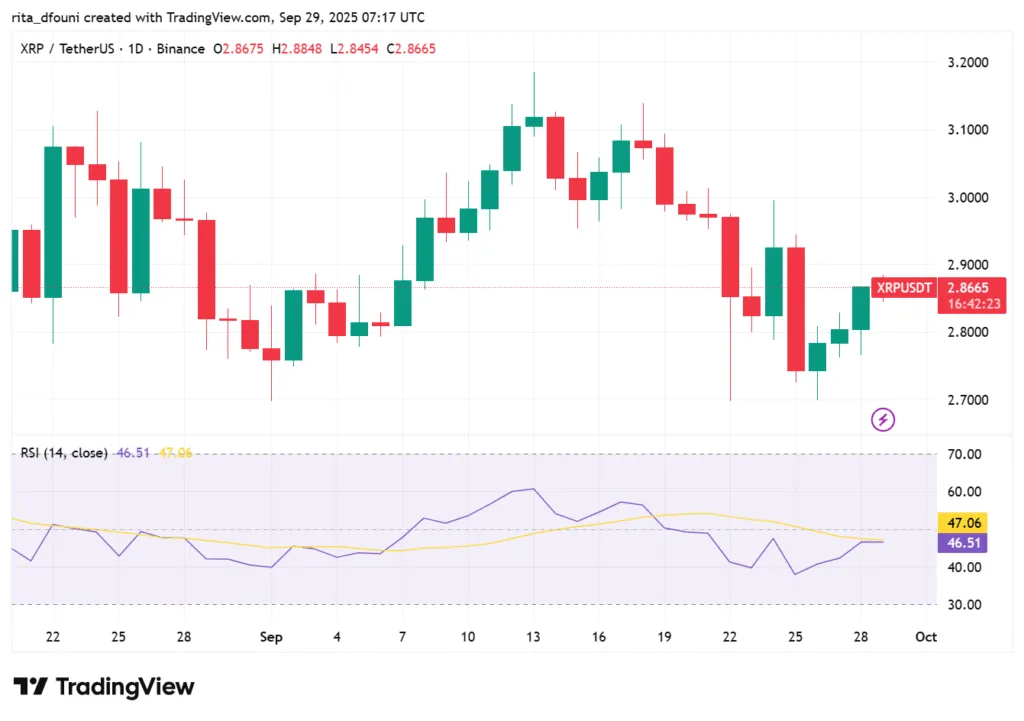
XRP is currently fluctuating slightly below the USD 3.00 psychological level, with the majority of transactions concentrated in the USD 2.94–2.99 range and regular attempts to reach USD 3.00–3.03 that decline due to lower liquidity. The behavior aligns with the month’s characteristics: positive yet limited, with purchasers emerging on minor declines and sellers protecting the initial round number above. The session tone reflects measured restraint instead of a trend, and the price continues to honor the same territory we have been monitoring for weeks.
Technical structure
The chart is closely bounded by a distinct resistance level and a clearly established base. Above, USD 3.03 serves as the immediate trigger. A strong close above USD 3.03 would confirm breakout conditions and attract momentum flows toward USD 3.20–3.30, corresponding with prior supply from earlier movements. Conversely, USD 2.91–2.95 remains a consistent support area; if this range is breached, the market will likely revisit USD 2.85–2.88, where demand previously mitigated pressure. Momentum indicators align with balance: daily RSI stays near neutral levels, and MACD histograms are compact and stable, indicating accumulated energy within a contracting range.
Derivatives & positioning
Positioning indicates active involvement but not ecstatic engagement. Open interest in perpetuals has stabilized following mid-month de-risking, allowing space for growth without the vulnerability associated with crowded long positions. Funding remains nearly unchanged, indicating that bulls are not aggressively paying a premium to maintain their exposure. Options sentiment leans toward bullish scenarios as the price nears the round figure: traders maintain their attention on short-term calls that would gain from a clear move above USD 3.03, while defensive puts are positioned in the USD 2.85–2.95 range. The overall result is a market willing to honor the range and show direction solely upon confirmation.
On-chain & ecosystem
Utility continues to be the foundation of XRP’s medium-term outlook. Payment channels utilizing Ripple infrastructure are expanding in various areas, maintaining consistent throughput and settlement operations on-chain. Transaction costs remain minimal and finality continues to be rapid, maintaining XRP’s relative benefit in remittance and liquidity-on-demand applications. Although these fundamentals do not compel an instant breakout, they clarify why moves down into the USD 2.90s draw buyers: genuine users and liquidity providers maintain activity even when speculative interest slows.
Macro alignment
The liquidity environment impacting the majors also affects XRP’s tape, but its response can vary slightly. The wider context of central bank easing tendencies and sporadic stock market fluctuations leads to alternating periods of risk-on momentum and sudden pauses. When Bitcoin and Ethereum show strength, XRP usually follows with a slight delay, and breakouts past USD 3.03 tend to be more sustainable. On the other hand, if risk signals diminish in stocks or major assets hesitate beneath their own thresholds, XRP usually returns to its compression band instead of pushing the trend independently. In other terms, the broader trend continues to determine the likelihood of USD 3.03 ultimately giving way.
Investor psychology
Sentiment is tentatively optimistic. The community stays engaged and attentive to headlines, yet the lack of excessive funding or biased stances indicates a preference for patience rather than excitement. Those with a longer investment perspective cite the growth of real-world infrastructure as a reason to remain invested despite volatility, whereas strategists tend to favor purchasing once confirmation is obtained instead of predicting it. The round-number magnet at USD 3.00 continues to create psychological influence: each approach prompts attempts to break out, yet participants remain disciplined in securing profits until the daily close confirms a regime change.
Outlook
A conclusive daily close beyond USD 3.03 would probably enhance movements toward USD 3.20–3.30, with continued support from options hedging if spot advances rapidly. Inability to remove the cap maintains the range; under these circumstances, the market will persist in oscillating between USD 2.91–2.95 support and USD 3.00–3.03 resistance, with any breach of USD 2.91 revealing USD 2.85–2.88 for a strength assessment after the level breaks, expect rapid movement.
