- Bitcoin surpasses $120K as ETFs attract record inflows and whales accumulate.
- U.S. legislative progress boosts confidence in Crypto’s regulatory future.
- Technical breakout above key moving averages triggers short squeeze.
Bitcoin (BTC) has surged past the $120,000 milestone, trading at $121,848 at the time of writing, driven by strong institutional inflows, renewed regulatory optimism, and bullish technical momentum.
Institutional demand lifts prices
According to MarketWatch, U.S. spot Bitcoin ETFs have now attracted $14.8 billion in cumulative inflows since launch. BlackRock’s iShares Bitcoin Trust alone has drawn more than $1.3 billion in just two days. Large Bitcoin holders often referred to as “whales” are also increasing their positions, signaling market confidence in Bitcoin’s long-term outlook.
Regulatory optimism fuels sentiment
Reuters reports that U.S. lawmakers are making progress on crypto-friendly legislation, including the GENIUS Stablecoin Act and the CLARITY Act. This “Crypto Week” in Washington has fueled optimism that the industry could benefit from a clearer, more favorable regulatory framework, reducing uncertainty and attracting further institutional participation.
Newsletter
Get weekly updates on the newest crypto stories, case studies and tips right in your mailbox.
Technical breakout confirms bullish trend
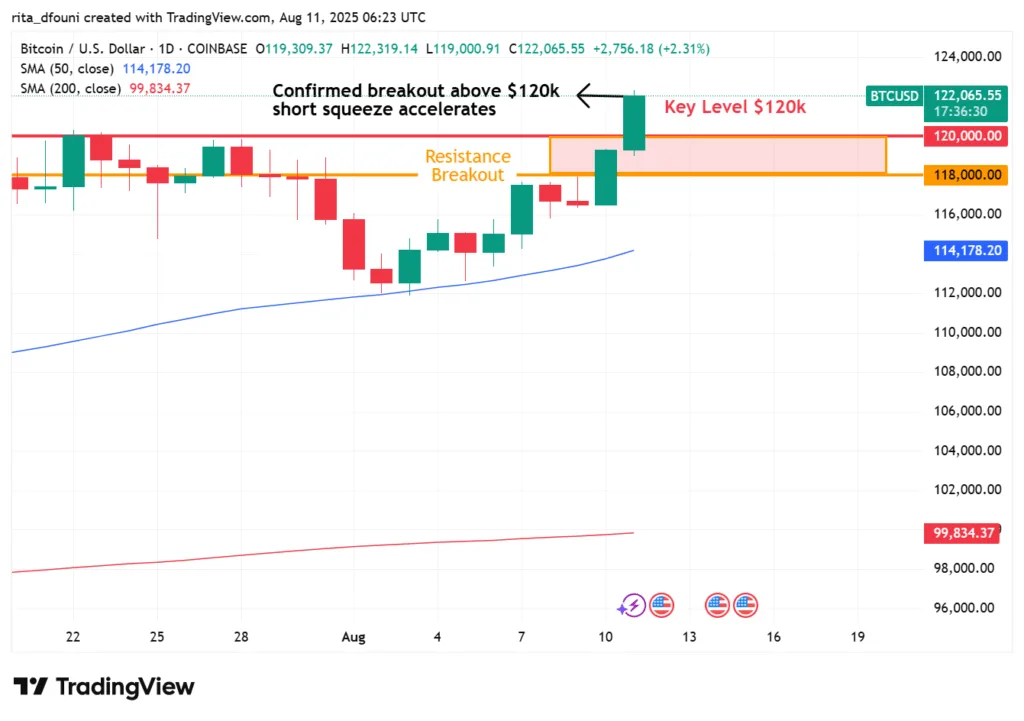
From a technical perspective, Bitcoin has broken above its 50-day and 200-day moving averages, reinforcing the bullish momentum. Analysts highlight that the breakout above the $118K–$119K resistance zone triggered a short squeeze, forcing bearish traders to close positions and accelerating the rally beyond $120K. This move has opened the door for potential retests of previous highs and possibly new all-time records.

The TradingView chart shows Bitcoin’s decisive breakout above the $118,000 resistance level (orange line) and the $120,000 psychological barrier (red line). The large green candle highlighted on the chart represents the confirmation of this breakout, accompanied by a short squeeze that forced bearish traders to close positions. The 50-day moving average (blue line) is trending above the 200-day moving average (red line), reinforcing bullish momentum. The shaded breakout zone between $118K and $120K illustrates the consolidation range before the rally, with the upward move signaling strong market confidence supported by institutional inflows and positive regulatory developments.
 Rita Dfouni


