Bitcoin (BTC) — Momentum on standby

Market overview
Bitcoin starts the week challenging the upper boundary of its month-long consolidation, remaining around USD 114,000–115,000 after staying strong above the crucial USD 113,000 pivot through last Friday’s close. The volatility contraction of the pair that characterized early October is finally easing: hourly ranges are expanding, and order-book imbalance is beginning to shift slightly bullish.
Spot liquidity stays robust; bids are positioned between USD 113,200–113,600, with ask clusters reaching toward USD 115,800–116,000. Weekend depth data from Binance and Coinbase Pro indicates consistent absorption of sales under USD 114,000, affirming that demand during dips continues even in the absence of a macro catalyst.
Momentum traders are seeking assurance that this movement transforms into a true breakout rather than another unsuccessful surge. The realized volatility of BTC over the past 7 days has increased from 23% to 31%, indicating that stagnant energy is being unleashed.
Technical structure
BTC’s range is converging around an upward short-term trendline originating from the USD 110,800 level. Support is positioned at USD 113,200 → 112,500 → 111,000, with resistance set at USD 115,500 → 116,000 → 117,500. A daily close surpassing USD 116,000 would provide the clearest bullish signal since late September, indicating a measured move target around USD 118,800–120,000.
A decline of USD 113,000 would disrupt the short-term uptrend and bring back USD 111,000–110,000 into play. RSI is near 55, indicating a neutral-positive stance, and the moving averages (20/50-day) have formed a slight bullish crossover. Candle bodies stay small, showing involvement without hostility.
Volume analysis indicates rising activity on green days and low turnover on red days, reflecting a bullish inclination that still necessitates confirmation with movement beyond USD 116,000.
Derivatives & positioning
Perpetual funding turned slightly positive at +0.008 %, indicating a resurgence in long interest without excessive speculation. Open interest increased by 4% week-on-week to USD 14.1 billion, with the majority occurring on major platforms. The options markets display the combat zone: call interest is focused between USD 120,000 and 125,000, whereas protective puts are grouped around USD 110,000. The 25-delta skew shifted to be somewhat call-biased, indicating that traders are beginning to factor in asymmetric upside potential.
Implied volatility has risen to 43%, marking its initial increase since early September. Dealers continue to be short gamma at the spot level; therefore, a prolonged move above USD 116,000 might automatically initiate delta hedging that intensifies upward momentum.
On-chain & ecosystem
Exchange balances persist in their slow decrease, approximately 1.2% month-over-month, indicating continued accumulation. Inactive supply indicators affirm holder confidence: 66% of BTC was last transferred over a year ago. Miner reserves demonstrate consistency; hash rate reached a record peak of 683 EH/s, highlighting network trust and operational profitability despite the reduction in block rewards.
Transaction fees stay reasonable, maintaining a strong throughput without any congestion. Institutional wallet movements indicate consistent inflows to custody services associated with ETF providers, consistent with last week’s slight net-positive ETF flow report (USD 85 million influx).
Macro alignment
Macro factors support a gradual shift in risk. The U.S. 10-year yield has decreased from 4.42% to 4.28%, lessening real-rate challenges. The Dollar Index (DXY) remains under 103.5, creating space for cryptocurrencies. In the meantime, stocks are fluctuating, but the volatility among asset classes continues to lessen, creating a scenario where BTC traditionally thrives as a liquidity indicator.
Traders will keep an eye on Wednesday’s FOMC minutes for any indications supporting a prolonged pause; dovish signals would strengthen the existing demand, whereas hawkish comments could bring back tension around USD 115,000–116,000.
Investor psychology
Sentiment is carefully optimistic. The audience acknowledges BTC’s inherent strength but won’t act preemptively on a breakout without proof. Social engagement is subdued, financial backing stays modest, and fear-greed indicators linger in a neutral zone. This emotional equilibrium is perfect for ongoing growth once validation emerges.
Short-term traders perceive chances in the return of volatility; longer-term investors view this period as a chance for accumulation. Both sides agree on one point: BTC’s upcoming 5% shift will probably determine its trajectory for the rest of October.
Outlook
The technical outlook for Bitcoin still appears optimistic, yet confirmation is still the lacking element. A consistent daily close above USD 116,000 would probably activate the breakout that traders have been expecting for weeks, revealing upside targets around USD 118,800 and USD 120,000, where significant concentrations of call open interest are located. On the other hand, not maintaining the USD 113,000 support could pull the pair back into the previous congestion area between USD 111,000 and USD 110,000, necessitating another liquidity reset before any further progress. Currently, the market remains in a phase of measured anticipation confidence is growing, yet it will not manifest until the charts indicate readiness. The upcoming crucial candle will determine the remainder of October’s sentiment.
Ethereum (ETH) — Poised for breakout continuation
Market overview
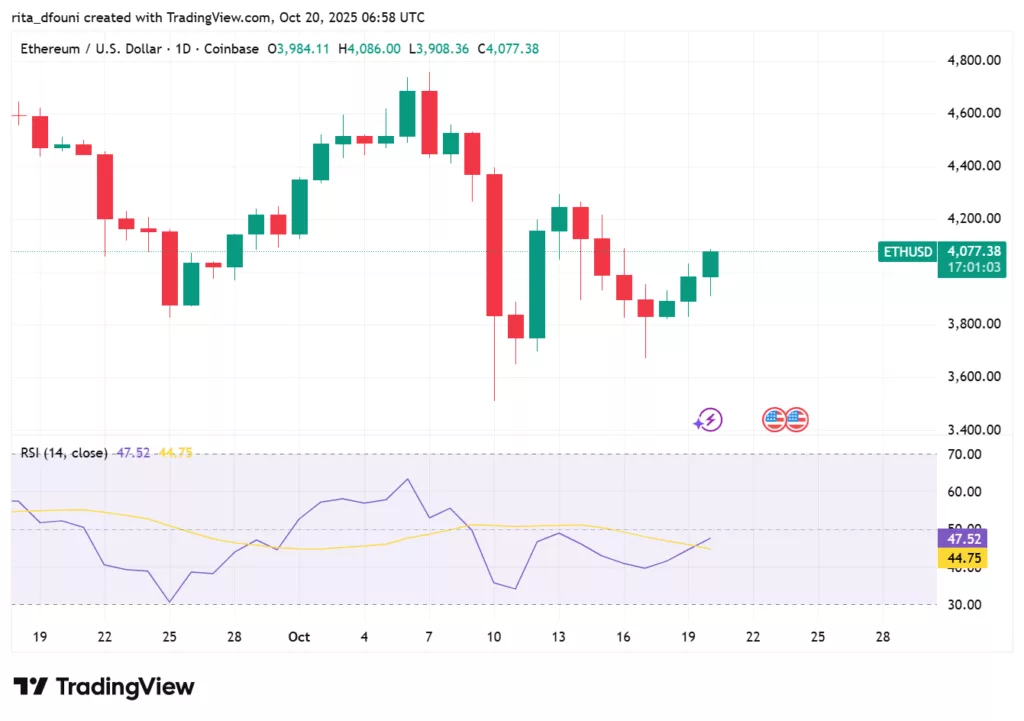
Ethereum starts the week stable around USD 4,420, subtly surpassing Bitcoin on a relative scale and continuing its prolonged consolidation within a tight range of USD 4,350–4,480. Market breadth stays strong, with steady liquidity present on both sides of the order book. Dips to USD 4,360–4,375 are quickly absorbed, showing a market that clings to structural support despite the lack of robust catalysts.
ETH’s performance in the last week has been marked by stability instead of thrill volatility has narrowed to one of its smallest ranges since June, while spot volume has remained consistent. This tendency is typical of Ethereum before significant breakout periods, where calm volatility frequently comes before a directional increase. Essentially, ETH is accumulating energy.
Technical structure
From a technical perspective, ETH’s configuration is a classic example of continuation. The daily chart creates an ascending triangle pattern, with increasing higher lows from USD 4,275 → 4,320 → 4,375, encountering a horizontal resistance around USD 4,480–4,500. This represents a typical volatility squeeze, which generally resolves toward the prevailing trend; in this instance, upward.
From a technical perspective, ETH’s configuration is a classic example of continuation. The daily chart creates an ascending triangle pattern, with increasing higher lows from USD 4,275 → 4,320 → 4,375, encountering a horizontal resistance around USD 4,480–4,500. This represents a typical volatility squeeze, which generally resolves toward the prevailing trend; in this instance, upward.
Momentum oscillators still indicate a preference for upward movement. RSI remains around 57 with a slight upward trend, and MACD is nearing a bullish crossover on the daily chart. Volume has decreased during the compression, a positive characteristic that has historically indicated accumulation instead of distribution..
Derivatives & positioning
Perpetual funding rates stay marginally positive at +0.006 %, suggesting a slight long bias without significant speculative excess. Open interest stands at USD 9.1 billion, an increase of almost 7% from the prior week, indicating renewed participation from leveraged traders following a prolonged stretch of inactivity.
Options data shows a similar expectation buildup: call open interest is concentrated at the USD 4,500–4,800 strikes, whereas protective puts are grouped around USD 4,200–4,250. The 25-delta skew shows a slight call bias, suggesting that traders are inclined to pay extra for upside protection, which often indicates potential volatility growth. Implied volatility, while currently low at 39%, has started to increase during the day, indicating that traders are beginning to prepare for fluctuations.
Dealer positioning continues to be short gamma close to the spot, indicating that a breakout over USD 4,500 might initiate automatic hedging flows that amplify the movement, whereas a drop below USD 4,350 could result in the opposite effect. This gamma imbalance renders ETH especially sensitive to any directional shift this week.
On-chain & ecosystem
Ethereum’s on-chain fundamentals continue to be strong. Gas fees have stabilized at approximately 22 gwei, reflecting a balanced system without network strain. Layer-2 solutions like Arbitrum, Optimism, and Base maintain high activity levels, accounting for more than 63% of the overall transaction volume. This consistent L2 throughput alleviates base-layer congestion and maintains overall ecosystem vitality.
Staking mechanics continue to be a fundamental optimistic factor. The overall staked ETH supply hit 33.9 million, representing almost 28% of the total circulation. The network’s burn process continues to counteract issuance, maintaining ETH as net deflationary during times of increased activity. DeFi TVL within the Ethereum ecosystem increased by 4% week-on-week, fueled by fresh capital inflows into restaking and yield-generating protocols.
Macro alignment
ETH continues to closely reflect global liquidity trends. Lower real yields and a consistent risk appetite have established a supportive atmosphere, while the approaching U.S. macroeconomic data, particularly FOMC minutes and CPI revisions, might bring about temporary volatility. ETH typically reacts favorably to a declining dollar and often shows delayed performance during times of stock market turbulence.
The correlation with BTC stays moderate at 0.77 over a 30-day period; however, ETH has demonstrated a tendency to lead BTC during breakout weeks, a trend that, if it continues, could make it the leader for the next upward move.
Investor psychology
The sentiment surrounding ETH is a calm assurance. Most traders understand that price is dynamic, not stationary. Funding and positioning indicate caution; the market has evolved from hasty pursuits to patience. Retail involvement continues to be low, whereas institutional desks have resumed gradual accumulation through OTC avenues. The emotional tone is positive yet controlled, embodying “calm before assurance.”
From a psychological perspective, this situation is optimal: euphoria is lacking, skepticism is low, and belief is gradually strengthening. Market players understand that once Ethereum surpasses USD 4,500, the upward movement may be rapid and self-perpetuating because of low liquidity beyond the resistance level.
Outlook
Ethereum’s perspective is characterized by equilibrium and tension. A confirmed daily close above USD 4,500 would affirm bullish momentum, paving the way toward USD 4,650–4,800 shortly. Inability to hold above USD 4,350 would indicate another range shift towards USD 4,275–4,200, maintaining the broader consolidation. Currently, ETH is exactly at the intersection of confidence and chance: poised for the candle that disrupts balance and defines October’s path.
Solana (SOL) — Structure tight, sentiment turning
Market overview
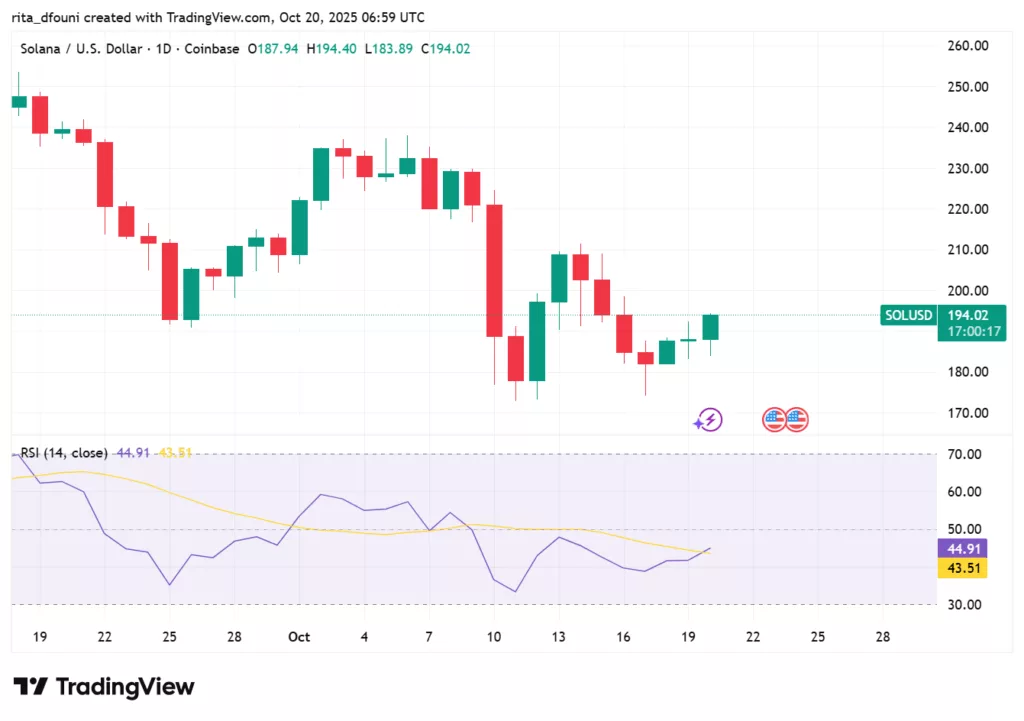
Solana starts the new week priced around USD 229, making slight gains from last week’s finish while staying within its tight trading range. The market persists in viewing USD 221 – 223 as reliable structural support, while USD 235 – 236 is seen as the pivot resistance. Intraday liquidity remains strong; daily spot volumes on Binance, Coinbase, and Bybit together approximate USD 1.8 billion, a bit more than earlier in the month, indicating that traders are starting to return to activity after an extended period of consolidation.
The resilience of SOL has emerged as one of the understated narratives of October. Despite a general decline in crypto volatility, Solana maintained a strong demand and sidestepped the larger downturns affecting lesser Layer-1 tokens. The duo’s strength is drawing fresh institutional interest, particularly from funds that desire beta exposure without entering micro-cap territories.
Technical structure
From a structural standpoint, the arrangement is evolving into a classic coil. The market has recorded successive higher lows at USD 221 → 224 → 226, maintaining respect for the flat top around USD 235 – 236. This formation an upward triangle below fixed resistance generally breaks upward if macro conditions allow.
A confirmed daily close above USD 236 would indicate a continuation of the breakout, aiming for USD 245 → 250 as the initial measured-move target, and potentially USD 258 if the momentum continues. Below, the short-term support level is at USD 223, with USD 210 – 205 next, where earlier demand reappeared in late September.
Derivatives & positioning
Perpetual funding stays steady at around +0.004 %, reflecting controlled leverage. Open interest rose by 6% in the last week to approximately USD 2.6 billion. The options market indicates traders are preparing for a continuation, with call interest focused on USD 240 / 250, whereas downside protection is constrained to minor clusters around USD 210. Implied volatility increased from 40 % to 45 %, reflecting expectations of a breakout effort.
Crucially, dealer gamma exposure stays negative close to spot, a situation that can enhance directional shifts. If SOL surpasses USD 236, delta-hedging by options desks could contribute to additional buying pressure, accelerating movement toward the mid-USD 240s.
On-Chain & ecosystem
Network fundamentals remain the basis of the optimistic outlook. Daily transactions surpass 50 million, reinforcing Solana’s dominance in high-throughput settlements. NFT and gaming sectors continue to be vibrant, with the total value locked in DeFi surpassing USD 5 billion (+4% w/w). Validator health metrics are strong: over 1,900 validators active, block-time variation under 0.4 seconds, and average uptime exceeding 99.6%.
Ecosystem traction is evident as cross-chain bridge activity to and from Solana rose by 9% week-over-week, with daily stablecoin transfer values surpassing USD 800 million. These signals suggest a dynamic network drawing transactional interest, rather than just speculative activity.
Macro alignment
SOL’s macro beta continues to be elevated; it responds significantly to BTC and ETH breakouts but declines less during their pullbacks. As global risk sentiment stabilizes and yields decline, the conditions favor strong performance in high-beta Layer-1. If BTC verifies above USD 116 k and ETH surpasses USD 4,500, Solana’s correlation trends suggest an outs.
Nonetheless, macro instability persists. An unexpected rise in CPI or a stern FOMC stance might tighten liquidity and hinder breakout efforts. Consequently, traders should consider USD 236 as a limit for both opportunity and risk.
Investor psychology
Sentiment regarding SOL has shifted to a cautiously optimistic stance. Social media engagement is rising once more, with traders calling it the “momentum chain.” Retail stays involved but not overly excited, while professional desks value its liquidity and responsiveness. The emotional terrain can be characterized as “hopeful rigor” a belief based on technical and fundamental verification.
From a psychological perspective, this creates a promising environment for a genuine breakout: expectations are positive but cautious, lowering the likelihood of a congested long position prior to validation.
Outlook
Solana is set for further growth but still needs confirmation. Should the price maintain a daily close above USD 236, momentum may progress towards USD 245–250, possibly reaching USD 258. If USD 223 cannot be maintained, it would delay the breakout scenario and reintroduce the USD 210–205 range. As long as neither extreme fails, traders can anticipate compression with a bullish tendency.
SOL continues to be the most pristine chart within elite altcoins, maintaining structural integrity, strong fundamentals, and emotional stability.The more extended this balance endures, the more intense the ultimate resolution will be.
XRP — Poised at the round-number hinge
Market overview
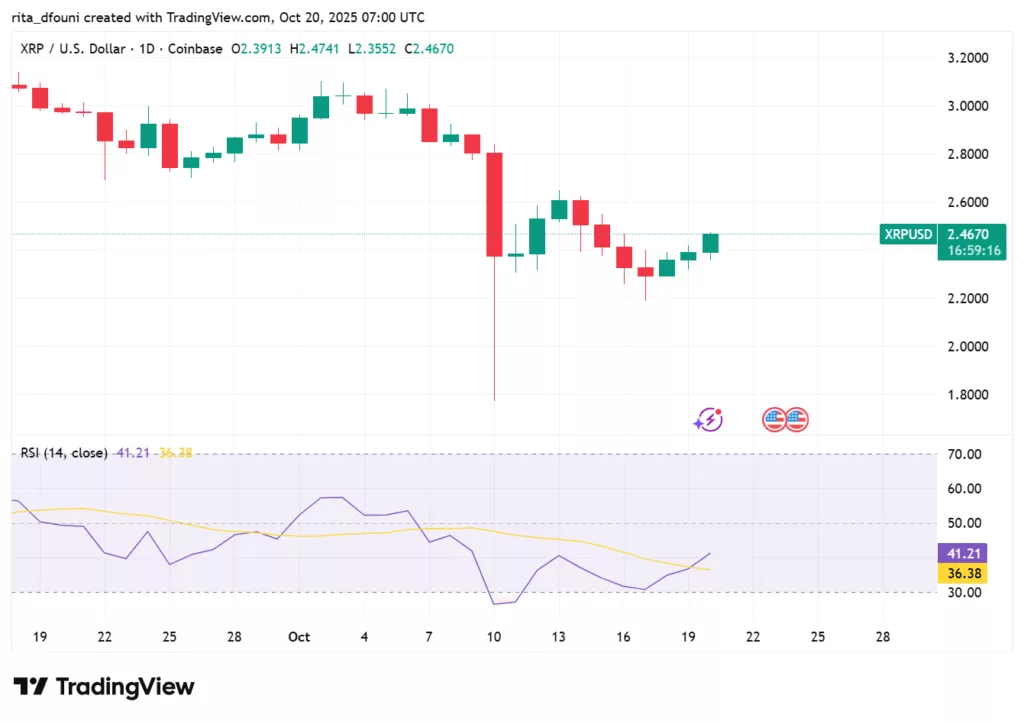
XRP begins the October 20 trading session hovering around USD 3.00, a psychological draw that has influenced intramonth trading. The tape stays organized: slight declines to USD 2.95–2.97 are purchased, while rises to USD 3.00–3.03 diminish as sell orders return. Liquidity is sufficient on both sides of the ledger, and realized volatility has tightened into one of the narrowest ranges of the quarter. This is not idleness; it is strategizing. The market anticipates a clear signal that transforms the round number from a point of conflict into a launching pad.
Technical structure
The chart’s meaning is clear. The immediate resistance level is USD 3.03. This level has been tested intraday several times but has yet to hold on a daily close. A confirmed close above USD 3.03 would indicate a shift in regime and pave the way to USD 3.20–USD 3.30, the resistance level that constrained June and September momentum. Under spot, USD 2.91–USD 2.95 serves as the active support level; a daily close below this could lead to a decline to USD 2.85–USD 2.88, the subsequent liquidity zone where demand was previously reinforced. Momentum stays neutral: the daily RSI is close to neutral with a slight upward trend, the 20- and 50-day moving averages are converging slightly below USD 3.00, and the MACD histogram has leveled off near zero. This alignment usually occurs during late-stage compression just before a directional breakout. Volume has decreased during the coil, a positive indicator that implies absorption instead of distribution.
Derivatives & positioning
Perpetual funding remains nearly unchanged, indicating that leverage exists but is not skewed in one direction. Open interest has increased incrementally week-over-week as traders enhance their exposure, but it remains significantly below the congested levels that led to previous failures at USD 3.03. Options activity remains concentrated in near-dated calls within the USD 3.00–USD 3.20 range, supported by protective puts positioned around USD 2.85–USD 2.95. The 25-delta skew is about neutral and implied volatility is low, suggesting a preference for defined-risk strategies rather than naked directional positions. From a microstructure viewpoint, dealers seem slightly short gamma around the current spot; if XRP can consistently stay above USD 3.03, delta-hedging might create additional mechanical demand and shorten the time to reach USD 3.20.
On-chain & ecosystem
Utility remains the foundation of XRP’s strength. Payment corridors utilizing Ripple’s infrastructure show consistent settlement volumes, with minimal fees and quick finality supporting throughput despite fluctuations in speculative interest. Exchange balances have slightly decreased this month, aligning with the gradual accumulation by long-term participants. Indicators of network health, including successful validations, transaction volumes, and gateway operations, remain consistent, while regional uptake in Asia-Pacific routes sustains the focus on genuine settlement instead of solely cyclical trading. These fundamentals do not compel a breakout, but they aid in understanding the continuous presence of bids whenever the price returns to the USD 2.90s.
Macro alignment
XRP’s trajectory is still linked to the major currencies and the overall liquidity environment. A favorable macro environment reducing real yields, a weaker dollar, and more stable equity volatility typically increases the likelihood that the USD 3.03 threshold will eventually break. XRP’s most significant gains in the past have taken place following upward movements in Bitcoin and Ethereum; when BTC surpasses its short-term ceiling and ETH exceeds USD 4,500, it usually leads to a shift towards payment-related assets. On the other hand, if the macro tone worsens due to unexpected data or policy statements, XRP typically retreats into its coil instead of establishing an independent trend, with USD 2.91–USD 2.95 serving as the line of defense.
Investor psychology
The audience is carefully taking advantage of opportunities. Traders acknowledge the magnetic pull of round numbers and the significance of the daily close, thus steering clear of early leverage within the range. Range experts persist in diminishing strength and purchasing during dips, whereas swing traders hold off for validation before taking on risk. Long-term investors focus on the settlement-rail narrative and view the consolidation above USD 2.90 as a robust foundation instead of a distribution. The lack of exuberant funding or biased positioning is positive: there is capital available to invest on signals, and little incentive for chaotic unwinding on usual news.
Outlook
XRP’s short-term plan is straightforward yet dichotomous. Achieving a daily close above USD 3.03 would indicate a breakout from compression and probably speed up towards USD 3.20–USD 3.30 due to a mix of momentum flows and options hedging. Not regaining the lid maintains prices fluctuating within the USD 2.91–USD 3.03 range, benefiting mean-reversion strategies. A drop beneath USD 2.91 would weaken the structure and necessitate a stability assessment at USD 2.85–USD 2.88. Patience and discipline continue to be the advantage until the market creates that definitive candle.
Cardano (ADA) — Methodical compression with defined edges
Market overview
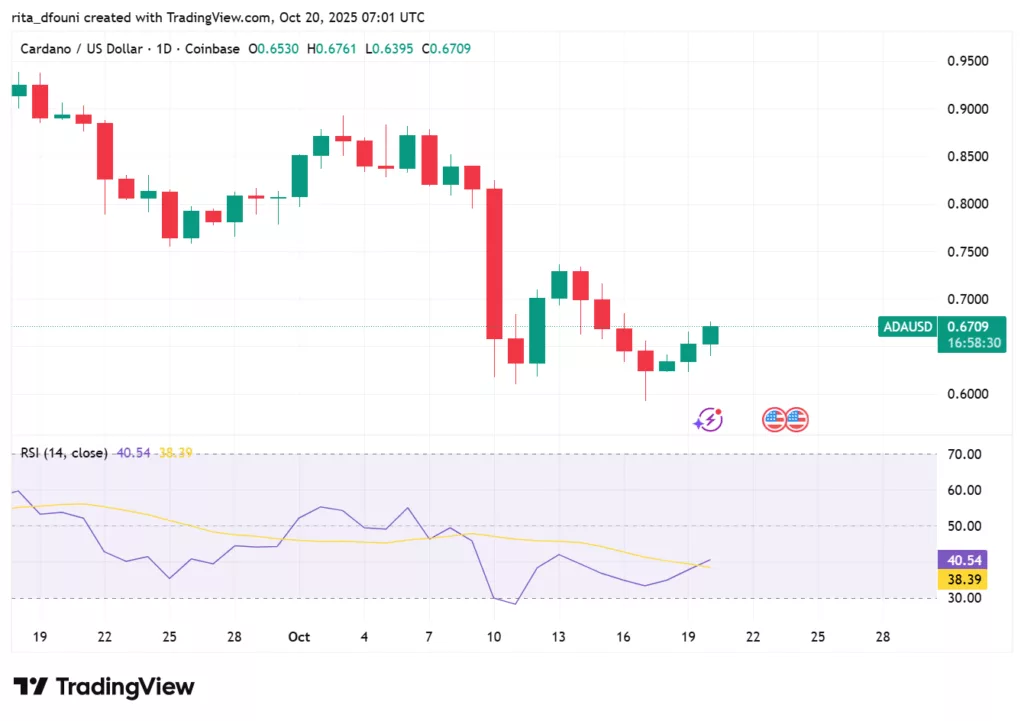
Cardano begins the October 20 session circling the mid-USD 0.80s, continuing a month-long trend of consistent range trading. Every decline to USD 0.82–USD 0.84 consistently draws spot interest, while moves up to USD 0.90–USD 0.905 encounter organized supply and profit-taking. Turnover remains consistent instead of lively; liquidity levels on primary exchanges still indicate stacked bids down to USD 0.80 and a diminishing array of offers over USD 0.905, a pattern reflective of subdued accumulation beneath a clearly communicated ceiling. In comparison to higher-beta alts, ADA’s realized volatility stays contained, making it a stabilizing factor during market fluctuations and a delayed amplifier when major coins surge.
Technical structure
The daily chart continues to show a clear rectangle confined by support at USD 0.82–USD 0.84 and resistance at USD 0.90–USD 0.905. Above that ceiling, the tape swiftly points to USD 0.96 and USD 1.02, where previous supply existed during August’s rise. The nearest support level is USD 0.80, while the more robust structural base is between USD 0.78 and USD 0.79, which initiated the upward movement in September. Momentum displays a neutral-constructive stance: the RSI remains close to 50 with a slight positive inclination, the 20- and 50-day moving averages have leveled off just beneath the current price, and the MACD histogram fluctuates around zero, indicating energy accumulation instead of trend fatigue. The price has honored the same intraday pivots for several weeks, raising the likelihood that the eventual breakout will be directional and sustained rather than a false signal.
Derivatives & positioning
The conditions for leveraging stay strong. Perpetual funding shows slight positivity, indicating a mild long bias without congestion. Open interest remains steady and significantly lower than summer highs, allowing room for growth once a trend is established. Options activity, while less robust than that of larger companies, reveals a recognizable pattern: call options tend to concentrate between USD 1.00 and USD 1.05 for short- to medium-term expirations, while protective puts accumulate in the range of USD 0.80 to USD 0.82. Implied volatility stays low in the mid-40s, causing defined-risk breakout strategies to be quite affordable. Dealer gamma seems slightly short close to spot; a clear movement above USD 0.905 or below USD 0.82 would probably activate mechanical hedging, leading to increased follow-through.
On-chain & ecosystem
Cardano’s fundamentals keep improving, which accounts for the ongoing demand at the lower threshold. Staking involvement stays high, maintaining a large portion of supply away from active circulation and minimizing impulsive sell pressure during risk-off moments. The total value locked in DeFi has increased over several weeks, as lending and DEX volumes have settled following the summer’s fluctuations. Developer engagement is among the top performers in terms of code commits, and gradual enhancements from the Hydra stack have subtly minimized obstacles for high-frequency scenarios. None of these data points determine the next candle, but they strengthen the network’s medium-term credibility and render revisits to USD 0.82–USD 0.84 appear more as value than weakness.
Macro alignment
ADA continues to be closely linked to the major cryptocurrencies and general liquidity indicators. Lower real yields and a stable dollar bolster the argument for risk assets as the year closes, although equity volatility continues to create a stop-and-go dynamic. Historically, ADA usually trails the initial breakouts of Bitcoin and Ethereum by several sessions, then speeds up as confidence increases and rotations shift down the quality spectrum. In practical terms, BTC acceptance above its near-term cap and ETH beyond USD 4,500 would significantly enhance the likelihood that ADA surpasses USD 0.905 with persistence instead of a temporary surge.
Investor psychology
The emotional terrain is calm and expert. Range traders persist in selling the upper rail and purchasing the lower rail, while momentum accounts have paused, awaiting a daily close beyond the range before committing larger positions. Retail excitement is subdued, a positive indicator when assessing the sustainability of any upcoming trend. Participants with a long-term outlook rely on staking returns and the gradual growth of ecosystem complexity, which mitigates the chances of chaotic reversals and maintains orderly positioning.
Outlook
Cardano’s journey is shaped by its tracks. A consistent daily close above USD 0.905 would ultimately transform resistance into support and establish a deliberate trajectory toward USD 0.96 and USD 1.02, with the potential for continued momentum if the shift to quality Layer-1s picks up after major assets indicate upward movement. Not breaking the ceiling maintains the range and ensures mean-reversion strategies remain profitable. On the other hand, a decline of USD 0.82 at closing would weaken the structure and necessitate a durability assessment at USD 0.80, with USD 0.78–USD 0.79 being the last line of defense before the base from August. Until a clear candle appears, ADA continues to demonstrate regulated compression: fundamentally robust, structurally solid, and emotionally stable a coiled spring anticipating the market’s approval to act.
